Upload date
All time
Last hour
Today
This week
This month
This year
Type
All
Video
Channel
Playlist
Movie
Duration
Short (< 4 minutes)
Medium (4-20 minutes)
Long (> 20 minutes)
Sort by
Relevance
Rating
View count
Features
HD
Subtitles/CC
Creative Commons
3D
Live
4K
360°
VR180
HDR
211 results
In this video, you'll learn how sampling reduces telemetry costs while keeping meaningful traces in modern observability systems.
71 views
4 days ago
In this livestream, Ahmed Bashir and Dhrumil Patel unpack why observability is shifting from push-based OpenTelemetry ...
54 views
Streamed 8 days ago
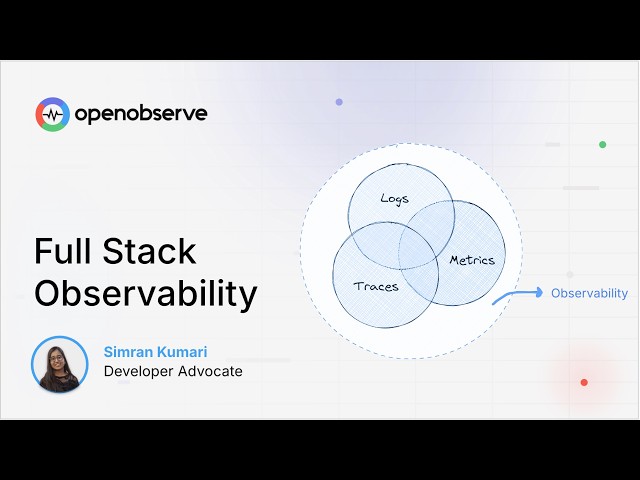
Understanding Full Stack Observability: Layers, Importance, and Real-World Application In this episode, Simran dives deep into ...
59 views
7 days ago
New Relic Vs Grafana | Which Cloud-Based Observability Platform Is Better? (2026) In this video, we break down New Relic Vs ...
70 views
Kibana vs Prometheus (2026) – Which One Is BETTER? Which monitoring and observability tool should you use in 2026?
0 views
Grafana vs Prometheus (2026) – Which One Is BETTER? Which monitoring tool should you use in 2026? In this video, I compare ...
18 views
While CRDs and API extensions are well-known, Kubernetes has many powerful but underutilized features. Going beyond others ...
17 views
Learn how to export telemetry data using OpenTelemetry step-by-step. In this video, we cover how to send Traces, Metrics, and ...
115 views
6 days ago
The best technical standard ever created came from one of the worst codebases in Unix history. We have Sendmail to thank for ...
7 views
2 days ago
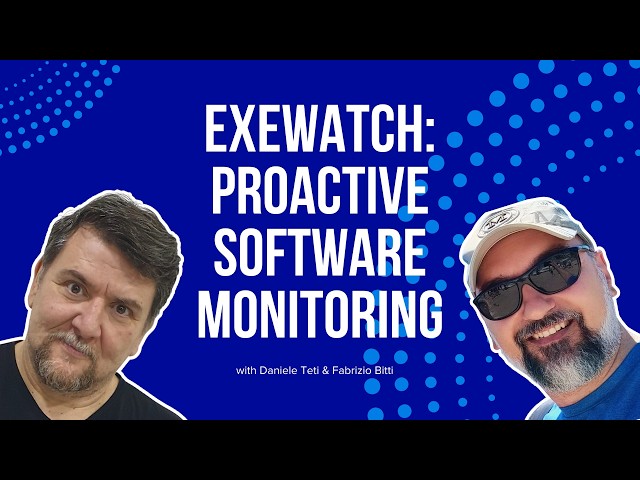
In this session, Fabrizio Bitti and Daniele Teti dive deep into the world of modern software monitoring, exploring the shift from ...
152 views
Monitoring and observability are often used interchangeably — but they are NOT the same. In this video, we break down: - What ...
106 views
Supercharging Grafana with Community Plugins In this session, we explore how to extend the power of Grafana beyond the ...
46 views
5 days ago
Stop the $50K DevOps bleed immediately and unlock superior digital decision-making by mastering proactive observability.
1 day ago
In this video, we'll build a full observability stack using the Grafana stack: Prometheus, Loki, Tempo, and Alloy, using a ...
1,389 views
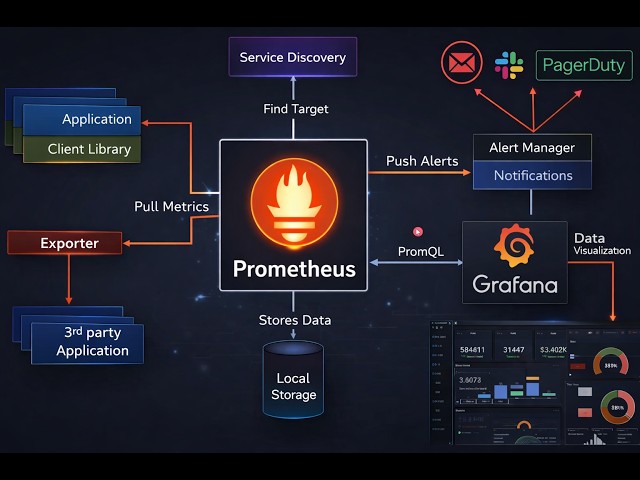
Master the Prometheus Architecture for Network Automation & NetDevOps In this comprehensive video, we break down the ...
228 views
У цьому стрімі DevOps01 говоримо про Observability Що працює, що ламається, де з'їдається бюджет і як observability ...
727 views
Think DevOps is just about faster code? Think again. In 2026, speed is a commodity—resilience is the real currency. As systems ...
4 views
Unlock the power of modern system monitoring by understanding the three core pillars of observability: Logs, Metrics, and Traces.
20 views
Preparing for a DevOps or SRE interview? In this video, I cover 25 most important Grafana Interview Questions & Answers that ...
420 views
Dynatrace Complete Tutorial | Zero to Hero Guide Want to master Dynatrace from scratch? This complete Dynatrace tutorial will ...
352 views
9 hours ago