Upload date
All time
Last hour
Today
This week
This month
This year
Type
All
Video
Channel
Playlist
Movie
Duration
Short (< 4 minutes)
Medium (4-20 minutes)
Long (> 20 minutes)
Sort by
Relevance
Rating
View count
Features
HD
Subtitles/CC
Creative Commons
3D
Live
4K
360°
VR180
HDR
541,057 results
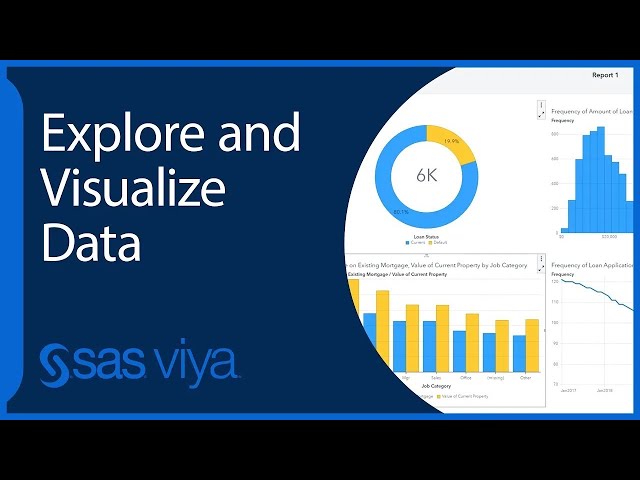
This Quick Start tutorial shows you how to explore and visualize data with SAS Visual Analytics. You learn how to access and ...
186 views
9 days ago
Transforming Visual Data into Actionable Intelligence with Azure AI Vision (A Practical Guide to Image Analysis, Automation ...
55 views
Streamed 4 days ago
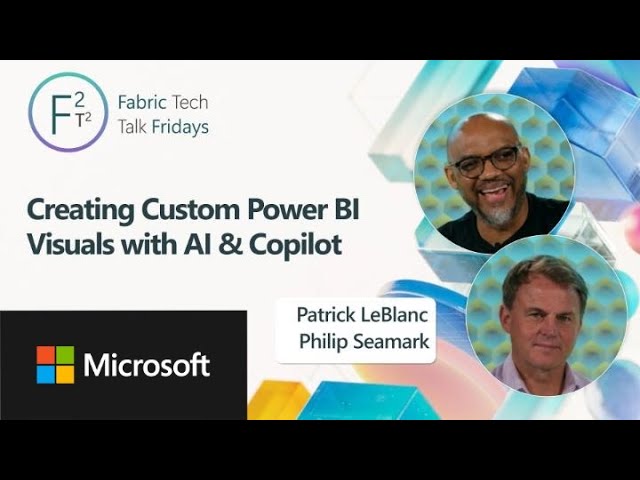
Join Patrick LeBlanc and Phil Seamark on this episode of Fabric Tech Talk Fridays as they explore how AI and language models ...
2,769 views
2 weeks ago
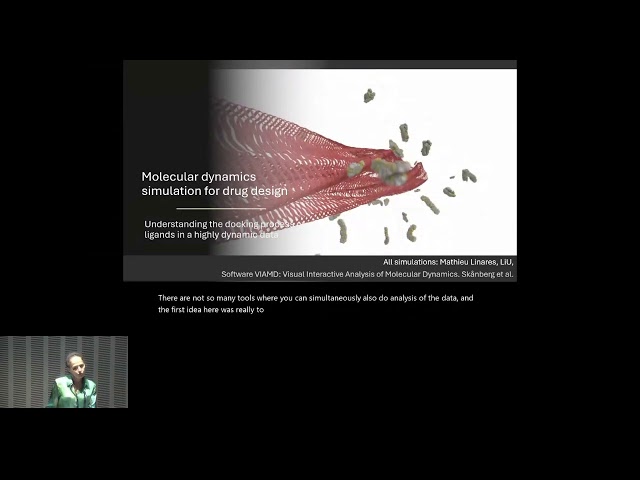
Visual Data Analysis Research in Biomedical Applications: Navigating the Line Between Scientific Novelty and Practical Impact ...
0 views
13 days ago
Stop leaving yourself vulnerable to data breaches. Go to my sponsor https://aura.com/vv to get a 14-day free trial and see if any of ...
447,150 views
6 days ago
Resources & Further Learning - Practice notebook → https://go.visuallyexplained.co/generators-exercises Gear & Support the ...
48,855 views
NVA (Nota Vision Agent) is Nota AI's next-generation vision intelligence solution designed for real-world, on-device deployment.
44 views
7 days ago
Pythonly App URL: https://pythonly.org Pythonly makes your browser a full AI and data-science platform, complete with datasets, ...
10 views
4 weeks ago
Ever wondered how long humans can tolerate breathing extremely bad smells? This video breaks down and compares different ...
462 views
How to Find Data Source in Visual Studio (easy Method) | Surfshark VPN Deal — Stay private and secure. $1.99/mo + 3 ...
2 views
3 weeks ago
Resources & Further Learning - Practice notebook → https://go.visuallyexplained.co/bools-cond-practice - Video: Python Elif ...
2,225 views
1 day ago
If they aren't already, visuals should be a core part of your communication strategy. Today we cover practical tools for presenting ...
[Transforming Retail with Intelligent Vision] AMobile redefines retail operations with our Smart Refrigerator Solution, powered by ...
29 views
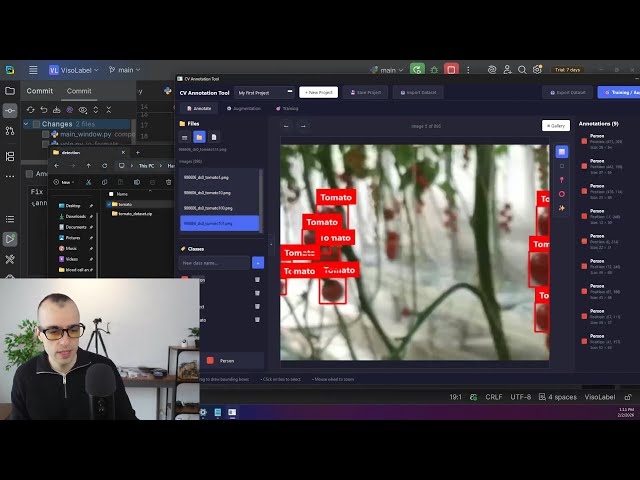
Learn how to build real-world AI vision systems → https://www.skool.com/ai-vision-academy Book a consultation ...
449 views
GoogleSheets #DataVisualization #SpreadsheetTips This tutorial provides a clear, step-by-step guide on how to insert an ...
3 days ago
Watch the Actually Good AI Video Generators https://youtu.be/-vwHldNaGPI?si=YcweiBMcR_zIKv9M In this video, I rank the ...
128,270 views
10 Hours Dark Cyber Data Tunnel | Silent Sci-Fi Visual | No Sound | 4K UHD Immerse yourself in a dark futuristic data tunnel ...
... step-by-step explanations of the data analysis process Expert tips on interpreting graphs and visual data Real-world examples ...
3,147 views
Data Vision knows clarity is built at separation. With MACS® Technology, she aligns cell separation to what sequencing, culture, ...
48,611 views
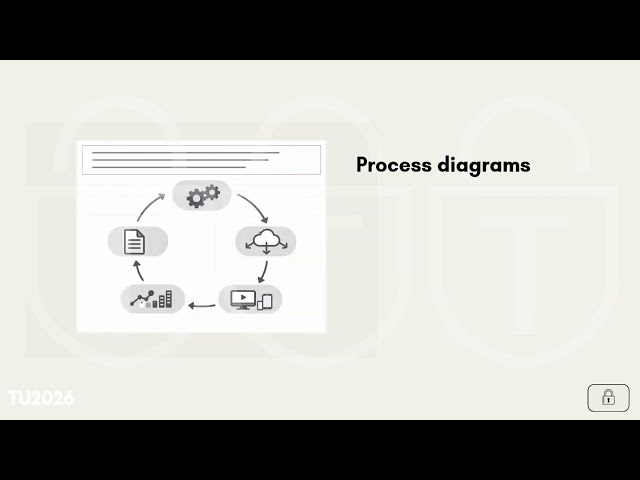
The video gives a brief introduction to the current types of visuals used in IELTS Academic Writing Task 1.
14 views