Upload date
All time
Last hour
Today
This week
This month
This year
Type
All
Video
Channel
Playlist
Movie
Duration
Short (< 4 minutes)
Medium (4-20 minutes)
Long (> 20 minutes)
Sort by
Relevance
Rating
View count
Features
HD
Subtitles/CC
Creative Commons
3D
Live
4K
360°
VR180
HDR
1,997,484 results
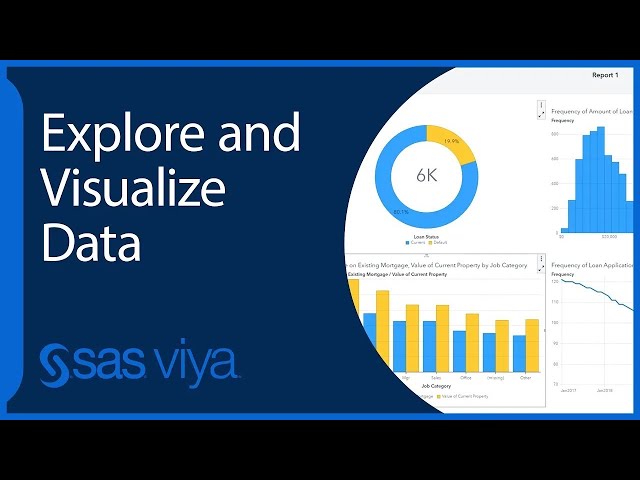
This Quick Start tutorial shows you how to explore and visualize data with SAS Visual Analytics. You learn how to access and ...
186 views
9 days ago
MENTORSHIP – Applications for the March 2026 cohort are now open! Apply here → https://theanalyticsaccelerator.com/ We're ...
45,111 views
9 months ago
Ready to become a certified watsonx AI Assistant Engineer? Register now and use code IBMTechYT20 for 20% off of your exam ...
94,124 views
8 months ago
In this lesson from our Academic Writing and Research Course, we focus on how to effectively use visual data in your dissertation ...
184 views
6 months ago
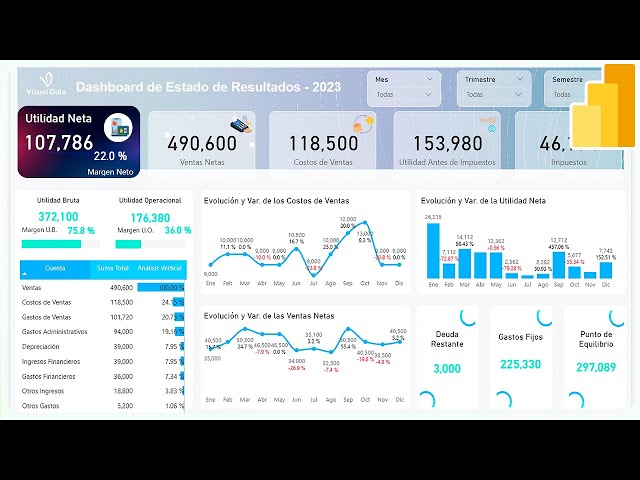
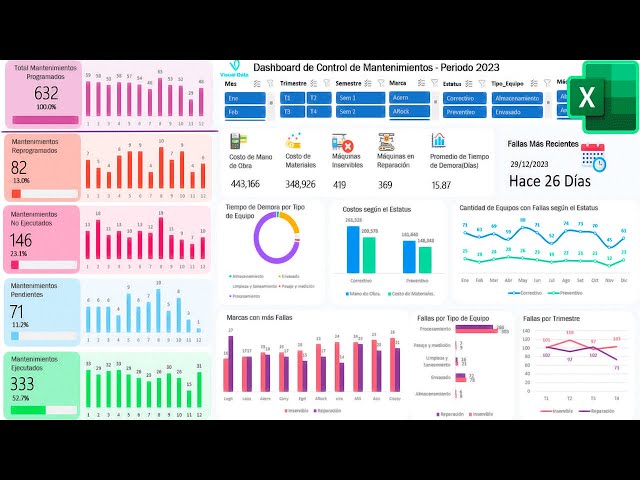
Este video está creado para mostrarte de una forma práctica y sencilla a crear un Dashboard en Power Bi. El Dashboard de ...
5,165 views
2 months ago
Start generating your own beautiful AI videos with LTX-2 http://bit.ly/4oGIeAB Want to get ahead in your career using AI?
93,060 views
3 months ago
What Is Visual Encoding In Data Visualization? In this informative video, we will dive into the world of visual encoding in data ...
266 views
10 months ago
Introducing Agentic Document Extraction Why ADE is different Visual grounding – Pin-points every word, table cell, and chart ...
49,915 views
11 months ago
InReAcTable: LLM-powered Interactive Visual Data Story Construction from Tabular Data Gerile Aodeng, Guozheng Li, Yunshan ...
45 views
4 months ago
6 views
Add a Visual Explorer section to your Power BI dashboards — a dynamic space where users can choose what and how they see ...
1,105 views
Transform your boring spreadsheets into stunning dashboards! Learn how to build a dynamic student data dashboard using ...
192 views
Explore more powerful analytics tools on our website: https://community.amplitude.com/ Join our next community session to ...
189 views
5 months ago
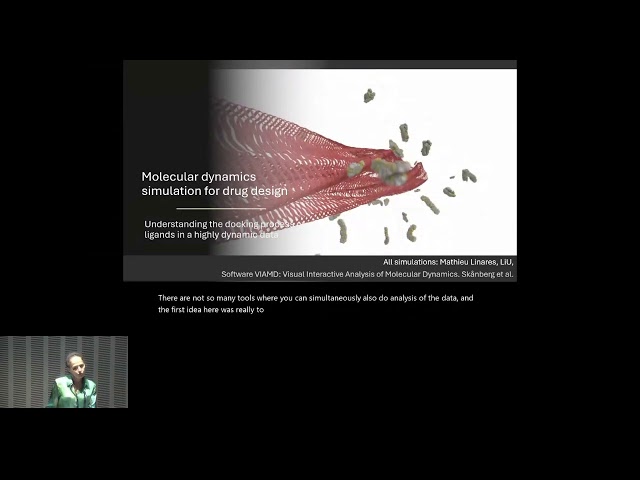
Visual Data Analysis Research in Biomedical Applications: Navigating the Line Between Scientific Novelty and Practical Impact ...
0 views
13 days ago
345 views
Resources & Further Learning - Practice notebook → https://rebrand.ly/oe61ojp - Practice exercises solutions video ...
213,251 views
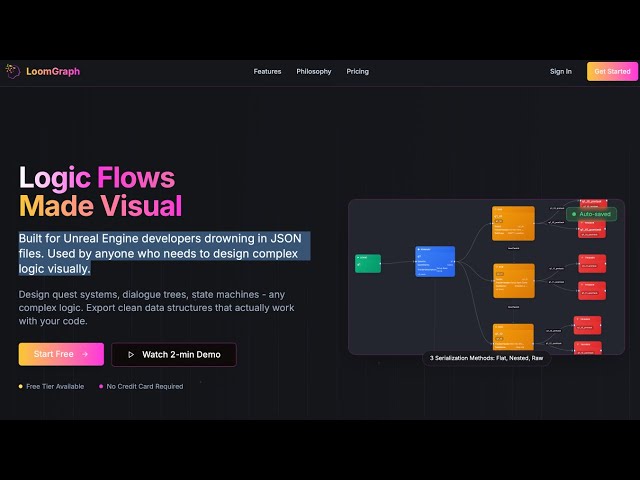
LoomGraph is a visual node based data editor where you can build, weave and structure any type of data flow. Design quest ...
23 views
Do you want to reduce downtime and improve the efficiency of your equipment maintenance? In this video, we'll create a basic ...
14,895 views
Visual data science helps make smart people—even smarter. Solve your most complex business problems with a tool that ...
467,145 views
This is a comprehensive course on data structures and algorithms. @algo.monster will break down the most essential data ...
480,377 views