Upload date
All time
Last hour
Today
This week
This month
This year
Type
All
Video
Channel
Playlist
Movie
Duration
Short (< 4 minutes)
Medium (4-20 minutes)
Long (> 20 minutes)
Sort by
Relevance
Rating
View count
Features
HD
Subtitles/CC
Creative Commons
3D
Live
4K
360°
VR180
HDR
12,842,498 results
44.3K subscribers
In this video tutorial, you'll see how to create a simple bar graph in Excel. Using a graph is a great way to present your data in an ...
1,819,327 views
6 years ago
After you've created a table, you can visually present information using a bar chart. This video will show you how to make a bar ...
117,860 views
2 years ago
In this video, you will learn how to create different types of charts in Microsoft Excel, such as column charts, bar charts, stacked ...
384,204 views
Ready to level up your options trading game? With this step-by-step guide, you'll discover how to find high-probability, winning ...
28,374 views
7 months ago
Draw a simple scaled bar graph to represent data with several categories. Visit: https://www.iconmath.com to see all videos and a ...
682,053 views
9 years ago
In this lesson, you will learn how to read, plot, and create bar charts and bar graphs. ▷ Free Practice Worksheet: ...
280,249 views
4 years ago
Tips for an IELTS bar chart in writing task 1: finding key features, paragraph content: (introduction, overview and body paragraphs) ...
6,451,587 views
11 years ago
Welcome to Barchart's tutorial for New Members! This video is the ultimate guide for new members to navigate the platform ...
10,298 views
1 year ago
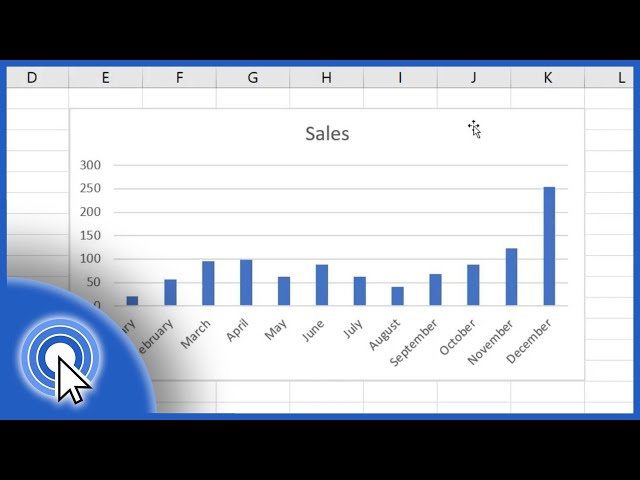
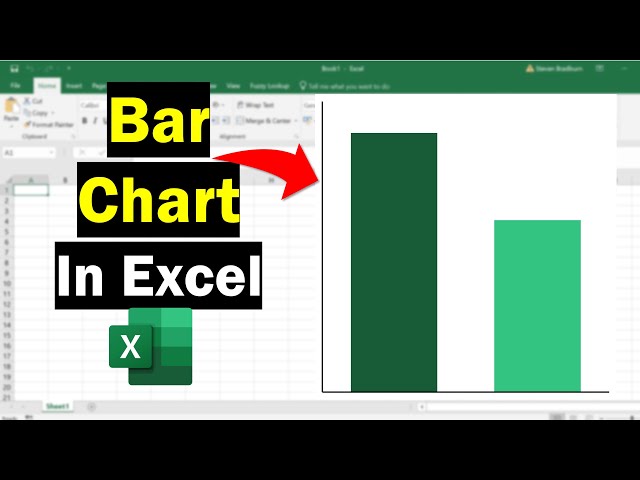
Join my newsletter https://steven-bradburn.beehiiv.com/subscribe In this tutorial, I'm going to show you how to create a basic bar ...
236,103 views
Check out the NEW Math Game we made at https://www.MageMath.com/ It is a full video game called Mage Math that helps kids ...
989,633 views
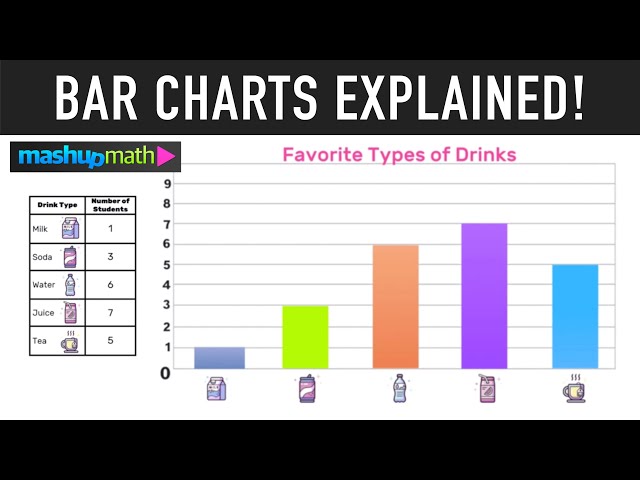
Matholia educational maths video on collecting data and creating a bar chart. #matholia #singaporemath #data #charts For more ...
173,192 views
5 years ago
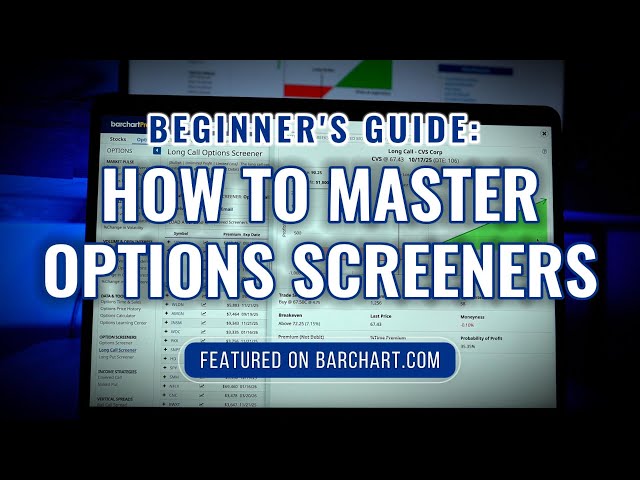
Ready to find your next winning trade? In this video, we'll walk you step-by-step through how to use the Barchart Options Screener ...
9,308 views
6 months ago
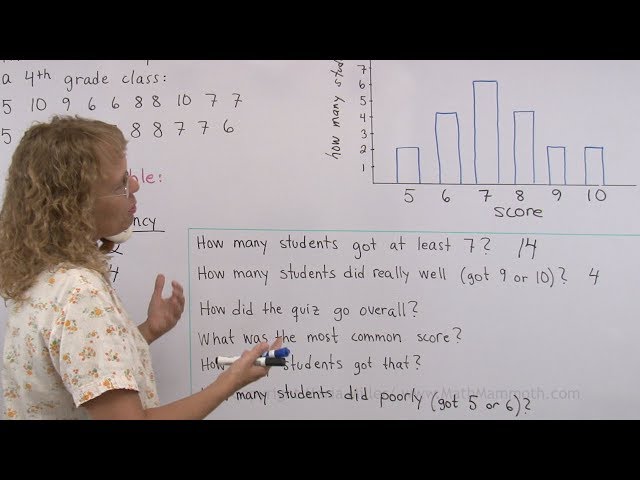
I show how to make a simple bar graph from numerical data of quiz scores. First, we make a frequency table, checking how many ...
310,990 views
8 years ago
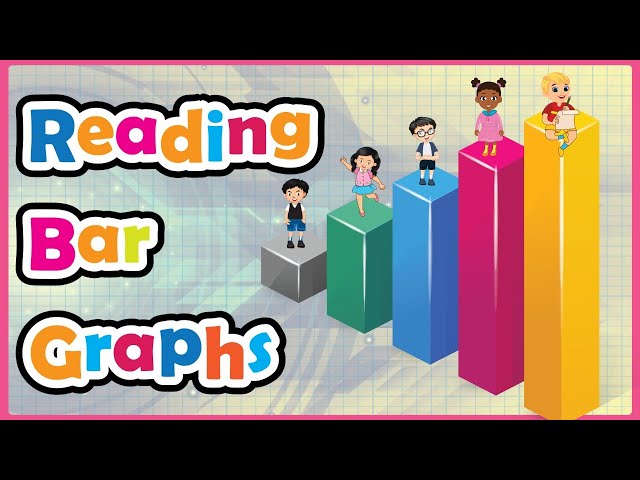
Do you know how to read a bar graph? Do you know the parts of a bar graph? This video lesson on reading bar graphs is here to ...
216,229 views
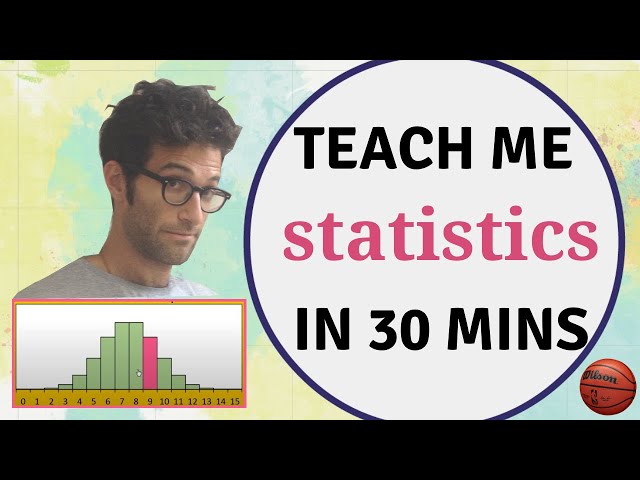
THE CHALLENGE: "teach me statistics in half an hour with no mathematical formula" The RESULT: an intuitive overview of ...
3,291,384 views
7 years ago
Pie charts are often used to visually express percentages. We'll show you how to make your own using a protractor. To learn more ...
214,729 views
How to Actually Get Better at Math Many students find it hard to understand mathematics because they were taught to memorize ...
675,293 views
Let's write a perfect IELTS Academic Writing Task 1 report describing a bar chart (a very popular type of task today!). Download ...
186,460 views
In this video i will explain how to create a bar chart with two series and green and red arrows for the differences. Data labels will ...
253,680 views
Bar Charts vs Candlestick charts, Which Are Best? http://www.financial-spread-betting.com/course/technical-analysis.html ...
23,682 views
Bar Graphs For Kids ! Welcome to Tutway, a unique platform where learning is fun ! Now there is no distinction between kids' fun ...
312,601 views
Quickly learn about bar charts, pie charts, histograms, stemplots, timeplots, and learn about which type of graphical tool is ...
703,664 views
10 years ago