ViewTube

ViewTube
Sign inSign upSubscriptions
Filters

Upload date

Type

Duration

Sort by

Features

Reset

5,804 results

Scoop Analytics
What is Data Visualization

What is data visualization, why it helps business teams make faster decisions, and the most common mistake people make when ...

2:20
What is Data Visualization

0 views

5 hours ago

ucrlibrary
AI-Assisted Data Visualization and Dashboards

This recorded workshop from UC Love Data Week 2026 will introduce you to the transformative potential of AI-assisted data ...

54:36
AI-Assisted Data Visualization and Dashboards

37 views

4 days ago

Xan 3D
How to Sort Objects by Any Value in Blender | 3D Data Visualization

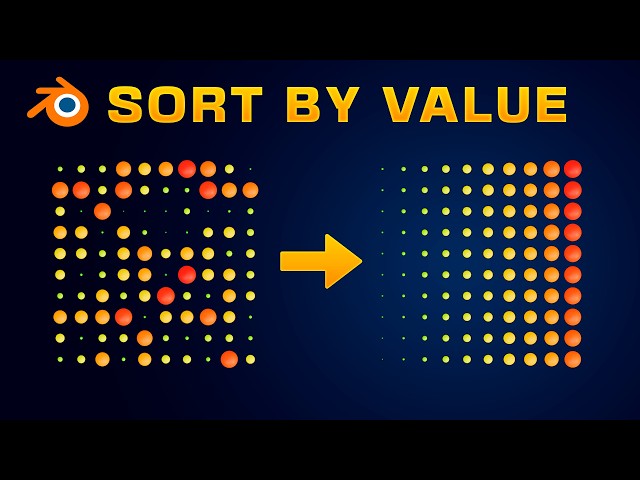
Learn how to sort and reorganize objects in Blender using Geometry Nodes based on any numerical value or attribute. In this ...

21:34
How to Sort Objects by Any Value in Blender | 3D Data Visualization

2,721 views

5 days ago

Starter Story
I Built a Niche App to $9K MRR

Jonathan Fishner built ChartDB, an open source database visualization tool for developers. This video breaks down how to ...

15:30
I Built a Niche App to $9K MRR

44,295 views

4 days ago

Tim Wells: Level Up Your Analytics Career
The BIGGEST Mistake People Make in Data Visualization Jobs

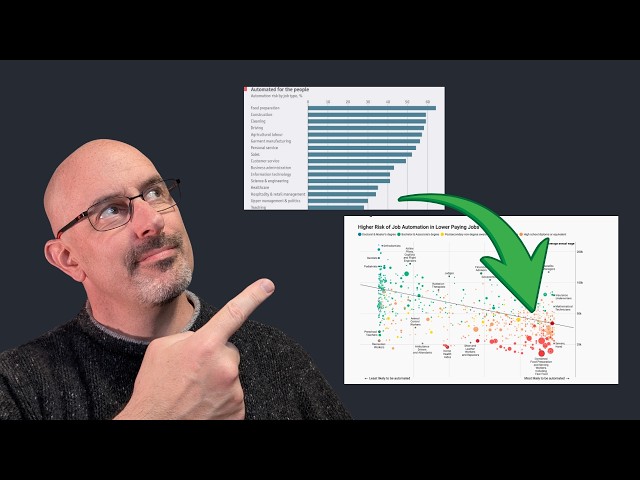
Most people misunderstand data visualization jobs. When you hear “data visualization,” you probably think dashboards, charts, ...

5:17
The BIGGEST Mistake People Make in Data Visualization Jobs

64 views

7 days ago

Lore So What
I Tried 50 Data Analyst Courses. Here Are Top 5

These are my top suggestions for data analyst courses that will help you get the skills fast and land a job offer in data. Data analyst ...

7:51
I Tried 50 Data Analyst Courses. Here Are Top 5

1,004 views

3 days ago

Bijan Bowen
Nano Banana 2 Is INSANE – Full Test of Google’s New Image Model!

Timestamps: 00:00 - Intro 00:48 - First Look 02:02 - Prompting Guide Mention 03:00 - Movie Poster Image Test 05:18 - Movie ...

29:15
Nano Banana 2 Is INSANE – Full Test of Google’s New Image Model!

14,516 views

3 days ago

ChartGen
Turn Questions into Charts in Seconds- AI Data Visualization with ChartGen AI

Most data analysis doesn't fail because of complexity. It fails because it takes too long to go from data → understanding.

0:11
Turn Questions into Charts in Seconds- AI Data Visualization with ChartGen AI

0 views

7 days ago

Scoop Analytics
What is data visualization — and why does it matter for your business decisions?

In this video, we break down data visualization in plain English: what it is, why it helps business teams make faster decisions, and ...

2:20
What is data visualization — and why does it matter for your business decisions?

0 views

1 hour ago

Data Is Wonderful
Population of Europe Countries (0 AD–2026) | Bar Chart Race

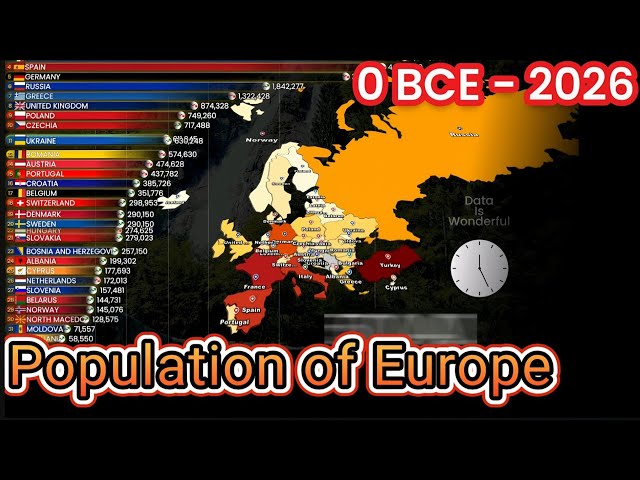
This video shows the population ranking of European countries from 0 AD to 2026 based on historical demographic estimates and ...

4:46
Population of Europe Countries (0 AD–2026) | Bar Chart Race

120 views

5 days ago

Simplilearn
Data Science Tutorial For Beginners 2026 | Data Science With Python | Data Science | Simplilearn

We'll create impactful data visualizations using Matplotlib and Seaborn to identify trends and patterns, and explore core Statistics ...

1:26:12
Data Science Tutorial For Beginners 2026 | Data Science With Python | Data Science | Simplilearn

1,438 views

6 days ago

Augmented Systems
How Data Visualization Enhances Business Intelligence Tools

Learn how data visualization strengthens BI tools like Power BI by turning complex data into clear, actionable insights for smarter ...

1:06
How Data Visualization Enhances Business Intelligence Tools

0 views

7 days ago

NCDIT
Data Visualization Accessibility for Dashboard Developers

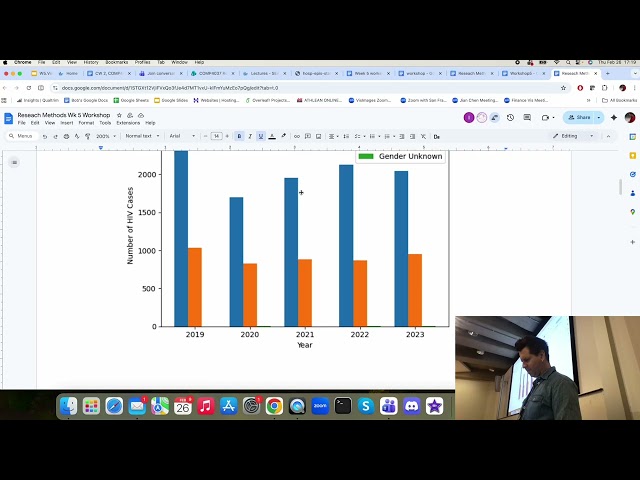
Accessibility Community of Practice - February 24, 2026 Presenter: John Cotter (NCDIT) How to build accessible data ...

57:10
Data Visualization Accessibility for Dashboard Developers

84 views

5 days ago

Bob Laramee
Research Methods Feedback on Data Visualization for Coursework 2

The YouTube channel dedicated to data visualization, research methods for computer scientists and other related topics. Connect ...

15:11
Research Methods Feedback on Data Visualization for Coursework 2

11 views

3 days ago

Med Research
AI-Powered Data Visualization Toolbox: From Visualization to Analysis

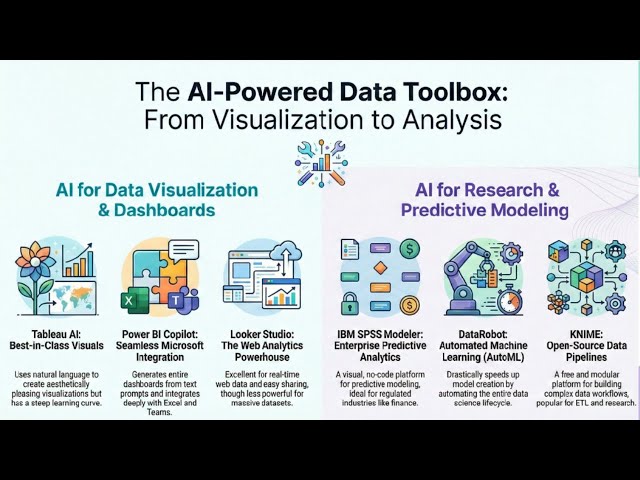
AI-Powered Data Visualization Toolbox: From Visualization to Analysis In today's data-driven world, visualization is no longer just ...

10:09
AI-Powered Data Visualization Toolbox: From Visualization to Analysis

24 views

4 days ago

Pradip Nichite
Build a Natural Language to SQL Agent with Data Visualization | FutureSmart Agent Platform

See how to build a text-to-SQL agent using the FutureSmart Agent platform — ask questions in plain English and get answers ...

1:53
Build a Natural Language to SQL Agent with Data Visualization | FutureSmart Agent Platform

236 views

4 days ago

Bob Laramee
Research Methods Lecture on Data Visualization (for Coursework 2)

The YouTube channel dedicated to data visualization, research methods for computer scientists and other related topics. Connect ...

52:45
Research Methods Lecture on Data Visualization (for Coursework 2)

20 views

6 days ago

Liora
Master Power BI and become a data visualization pro

Learn Power BI & Turn Data Into Decisions Every data career needs strong visualization skills. In this training, you'll learn how to ...

3:38
Master Power BI and become a data visualization pro

0 views

7 days ago

Hightopo
Hightopo 3D Smart Medical Dashboard & Data Visualization Wall

The Hightopo 3D Smart Medical Dashboard & Data Visualization Wall is a comprehensive digital twin, data visualization, and ...

0:36
Hightopo 3D Smart Medical Dashboard & Data Visualization Wall

37 views

6 days ago

Simon Sez IT
How to Use Excel Visualization Tools for Microsoft Project

Learn how to use Excel's visualization tools to analyze and present data from Microsoft Project. This tutorial shows you how to ...

6:36
How to Use Excel Visualization Tools for Microsoft Project

660 views

4 days ago