ViewTube

ViewTube
Sign inSign upSubscriptions
Filters

Upload date

Type

Duration

Sort by

Features

Reset

616 results

Scoop Analytics
What is data visualization — and why does it matter for your business decisions?
2:20
What is data visualization — and why does it matter for your business decisions?

0 views

0

Scoop Analytics
What is Data Visualization

What is data visualization, why it helps business teams make faster decisions, and the most common mistake people make when ...

2:20
What is Data Visualization

0 views

4 hours ago

MedicalHealthData
Which Country has the Highest Suicide Rate? (1900–2025)  #barchartrace, #datavisualization

This video shows the evolution of suicide rates per million inhabitants by country from 1900 to 2025 in a dynamic bar chart race ...

1:01
Which Country has the Highest Suicide Rate? (1900–2025) #barchartrace, #datavisualization

0 views

1 day ago

Data Tutorials
Amazing Power BI Project | End to End in 2 hours | Power BI Dashboard 2026 #powerbi

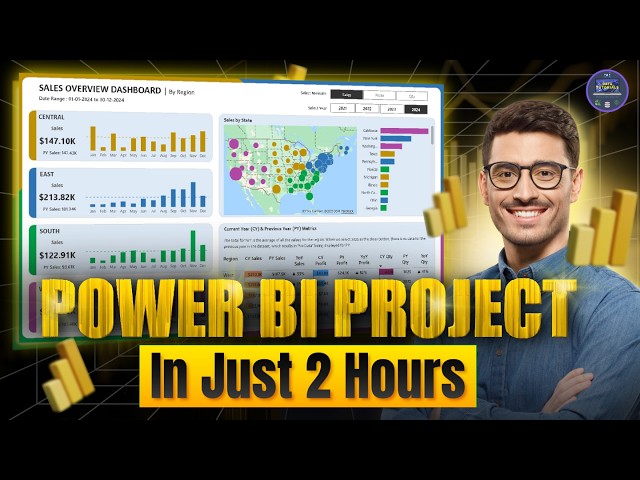
dataanalytics #powerbi #sql #python #excel #tableau Amazing Power BI Project | End to End in 2 hours | Power BI Dashboard ...

1:53:20
Amazing Power BI Project | End to End in 2 hours | Power BI Dashboard 2026 #powerbi

939 views

11 hours ago

INFORMATION
Sales Data Visualization challenge

code link https://colab.research.google.com/drive/19dSHtZNX4EAuwZ6fQbK2geTAH6LMZ1SB?usp=sharing.

11:27
Sales Data Visualization challenge

4 views

9 hours ago

Simply Cyber - Gerald Auger, PhD
I Fed My LinkedIn to Claude Code and What It Found Was Wild

Your LinkedIn data contains career intel you can't see with the naked eye. I downloaded all 50 CSV files from my LinkedIn export, ...

8:31
I Fed My LinkedIn to Claude Code and What It Found Was Wild

3,167 views

19 hours ago

Uzair Mehmood
Microsoft Excel Interactive Dashboard | Job Market Overview | Data Visualization Project

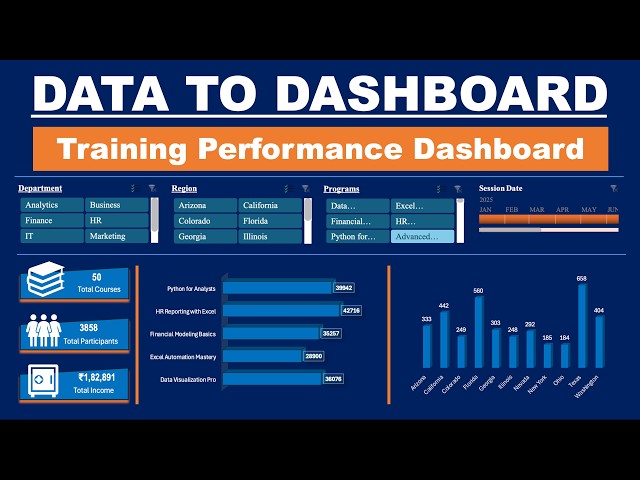
In this project, I built an interactive Microsoft Excel dashboard to analyze job market trends and extract meaningful insights from ...

0:43
Microsoft Excel Interactive Dashboard | Job Market Overview | Data Visualization Project

0 views

7 hours ago

Uzair Mehmood
IBM Cognos Analytics Dashboard | Shoperoo Retail Sales Insights - 2

This project demonstrates practical skills in business intelligence reporting, dashboard design, and data visualization using ...

0:44
IBM Cognos Analytics Dashboard | Shoperoo Retail Sales Insights - 2

0 views

6 hours ago

Andreas Exadaktylos
How to Create a Dynamic Monthly GANTT CHART in Excel (Step-by-Step)

... Infographics & Data Visualization Masterclass ▶️ https://bit.ly/melloncharts Excel Tips & Shortcuts: 100+ Powerful Hacks for ...

20:05
How to Create a Dynamic Monthly GANTT CHART in Excel (Step-by-Step)

4 views

14 minutes ago

Office Monk
Professional Excel Dashboard Just in 10 Minutes (No VBA)

... ✓Excel Data Visualization ✓Excel Charts & Formatting ✓Interactive Excel Reports ⏱ Time required: Just 10 minutes Tools ...

22:38
Professional Excel Dashboard Just in 10 Minutes (No VBA)

55 views

9 hours ago

Design Zone 1.0
How to Set Trendline to 0 in Google Sheets | Force Intercept to Zero (Easy Tutorial)

... to zero and adjust axis settings for accurate data visualization. This method is perfect for students, business analysts, marketers, ...

1:13
How to Set Trendline to 0 in Google Sheets | Force Intercept to Zero (Easy Tutorial)

0 views

2 hours ago

Mohamed Eladawi (محمد العدوى)
Tableau Training 2026: Tableau Maps Made Easy | Filled, Points, Dual Axis & Heatmaps (Session 5)

In Tableau Training 2026 – Session 5, you'll learn everything you need to know about Maps in Tableau (Basics + Intermediate).

51:32
Tableau Training 2026: Tableau Maps Made Easy | Filled, Points, Dual Axis & Heatmaps (Session 5)

40 views

9 hours ago

Unreal Engine
Elektrobit’s EB Civion Digital Cockpit Suite, Powered by Unreal Engine 5

Watch this video for a look at Elektrobit's new digital cockpit product line, the EB civion. This suite of HMI solutions is designed to ...

1:53
Elektrobit’s EB Civion Digital Cockpit Suite, Powered by Unreal Engine 5

156 views

23 minutes ago

Rand Fishkin
New usage graphs in Spark Toro

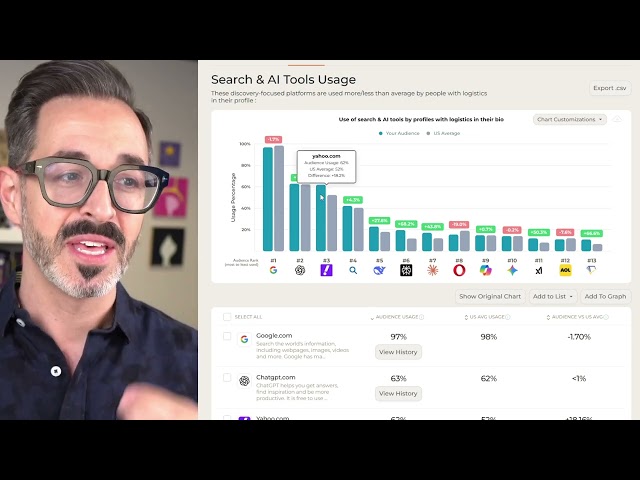
The number one rule of data visualization: make it obvious. We just updated SparkToro's graphs to show both usage and the delta ...

1:10
New usage graphs in Spark Toro

0 views

1 hour ago

Analytic Sages
How to Write Investor-Ready Research Reports Using Data and Onchain Insights with Mr. Maus

... to frame your onchain findings – Turning raw data into a story that investors can't ignore ✓ Data visualization principles – How ...

Upcoming
How to Write Investor-Ready Research Reports Using Data and Onchain Insights with Mr. Maus

0 views

0

Business Analyst Community - COEPD
Tableau awareness session

In this session, we introduce Tableau, one of the world's leading Business Intelligence and Data Visualization tools, widely used ...

1:53:31
Tableau awareness session

12 views

5 hours ago

Koenig Solutions
Deliver Live Dashboards with Microsoft Fabric Real-Time Intelligence

Deliver Live Dashboards with Microsoft Fabric Real-Time Intelligence March 1 · 8 PM IST – Set Reminder ▶️ Modern ...

1:13:37
Deliver Live Dashboards with Microsoft Fabric Real-Time Intelligence

52 views

Streamed 1 day ago

Linear Digressions
The Grammar Of Graphics

... approach to graphics taken in ggplot2, and makes clear the assumptions and structure of many familiar data visualizations.

35:39
The Grammar Of Graphics

0 views

23 hours ago

Stat Verse
World Largest Automobile Companies by 2026 🔥📊 | Data Comparison

... ranking • Clean & engaging data visualization • Country of origin • Brand positioning (Luxury, Premium, Mass Market, EV, etc.)

1:24
World Largest Automobile Companies by 2026 🔥📊 | Data Comparison

0 views

2 hours ago

SMILE ROAD
Working with Data Frames, Histograms, and Bar Plots | R Lesson 2 for SHS Learners

Welcome to R Lesson 2 for Senior High School learners! In this lesson, we explore data frames in R and learn how to organize, ...

9:07
Working with Data Frames, Histograms, and Bar Plots | R Lesson 2 for SHS Learners

0 views

15 hours ago