Upload date
All time
Last hour
Today
This week
This month
This year
Type
All
Video
Channel
Playlist
Movie
Duration
Short (< 4 minutes)
Medium (4-20 minutes)
Long (> 20 minutes)
Sort by
Relevance
Rating
View count
Features
HD
Subtitles/CC
Creative Commons
3D
Live
4K
360°
VR180
HDR
545 results
Check out Brilliant at https://brilliant.org/TheOverviewEffekt/. You can sign up for free and with that link and get a 20% discount on ...
1,577,030 views
6 days ago
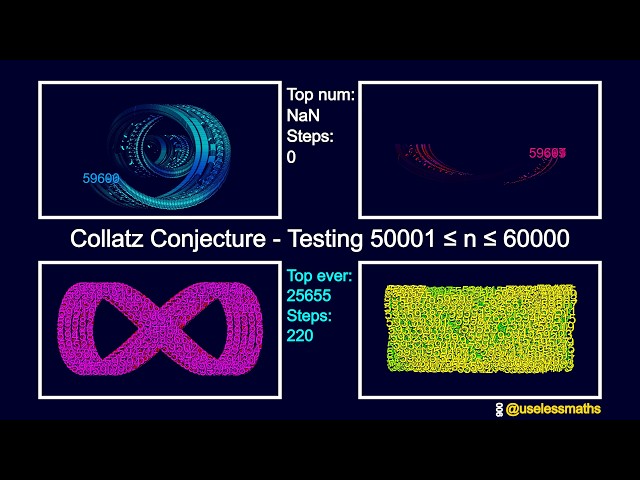
Can we find a number that never reaches 1? In this video, we dive deep into the Collatz Conjecture, testing four different ranges of ...
8 views
4 days ago
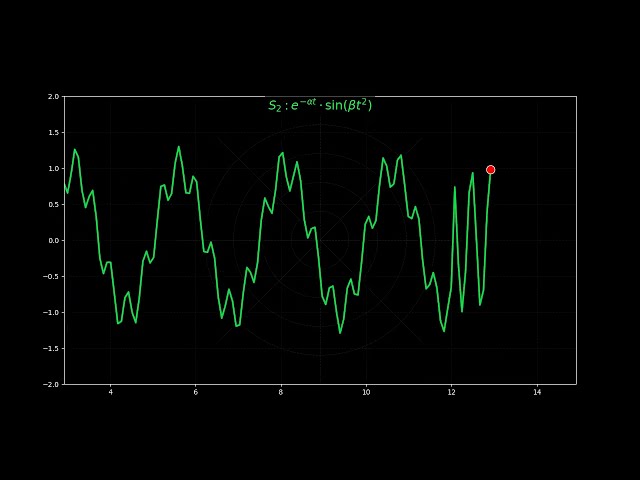
60 seconds. 5 impossible equations. 1 sentient dot. Watch as pure mathematics takes a physical form on a dual-grid radar.
92 views
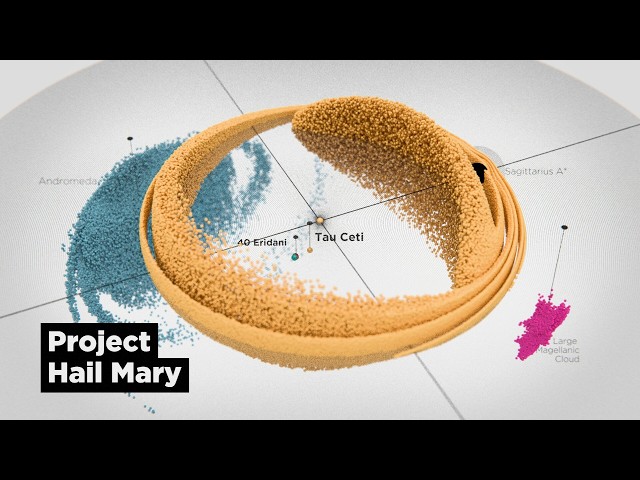
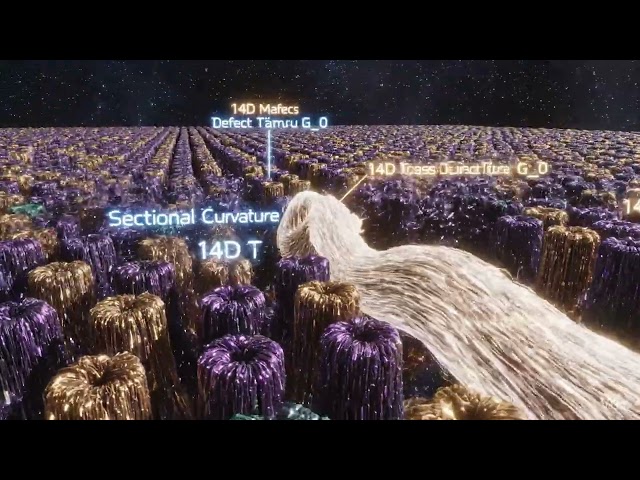
A breathtaking, mathematical visualization within a deep-space setting. Visualize the Observerse not as a 4D grid, but as a dense, ...
2 views
3 days ago
Stop memorizing boring formulas and start seeing the "pictures" behind the math! 🖼️ In this episode of Sciverse, we reveal the ...
3 views
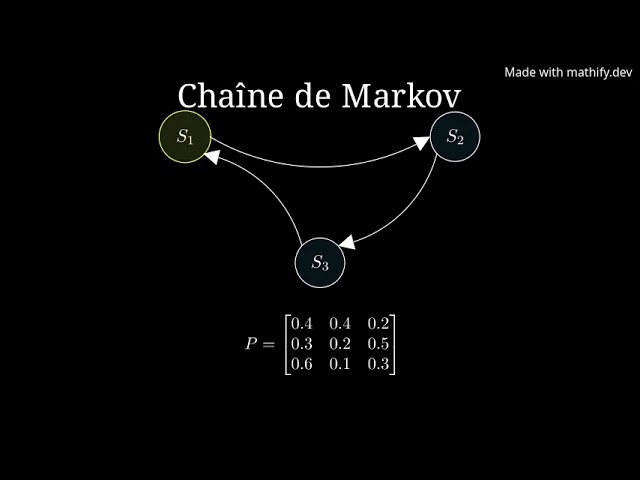
This animation visualizes a Markov chain, illustrating transitions between three states arranged as a triangle. Watch as a yellow ...
This animation showcases a dynamic circle with vibrant scale and color effects, accompanied by a moving dot. It's a simple yet ...
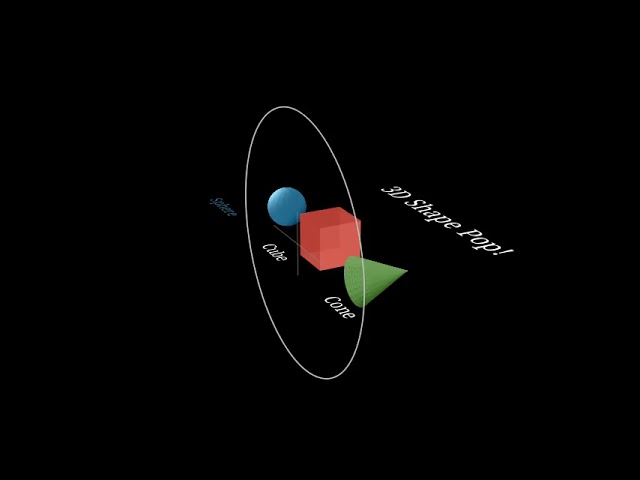
Explore 3D shapes with this fun animation featuring a sphere, cube, and cone. Each shape pops on a stage, inviting you to ...
0 views
5 days ago
This stream features curated mathematical visualizations and educational images. ⏰ Images rotate every 60 seconds for optimal ...
4 views
Streamed 4 days ago
Turn rhythm into geometry. In this video, I built an interactive polyrhythm visualizer that transforms musical patterns into animated ...
268 views
Educational mathematics content streamed live. This stream features curated mathematical visualizations and educational images ...
What happens when you turn pure trigonometry into living art? In this video, I've coded a custom visualizer using p5.js that ...
108 views
1 day ago
Hi Guys, This video visualizes the concepts of signal orthogonality and non‑orthogonality, using basis functions as examples.
26 views
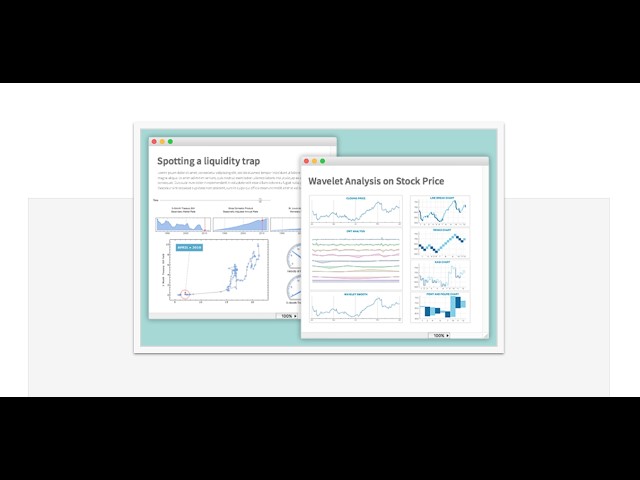
Join us for our Getting Started with Interactive Reporting webinar, and we'll show you how to create dynamic dashboards, ...
110 views
Streamed 7 days ago
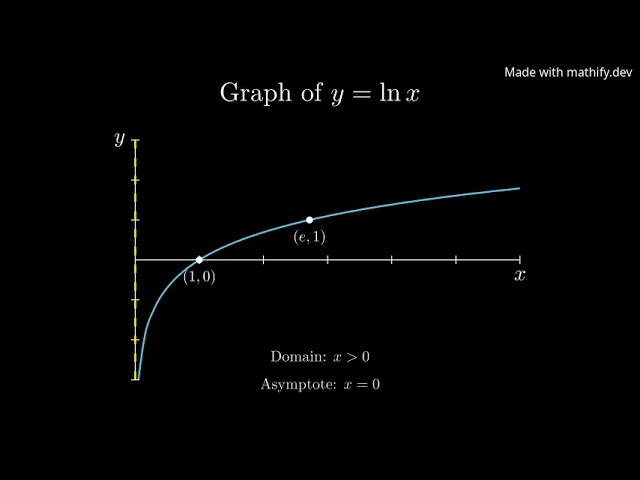
This animation visualizes the natural logarithm function, y = ln(x), detailing its graph, domain, asymptote, and key points (1,0) and ...
2 days ago
68 views
What if a single input gives you two valid outputs? On the ordinary number line that's a problem. Riemann figured out how to fix it ...
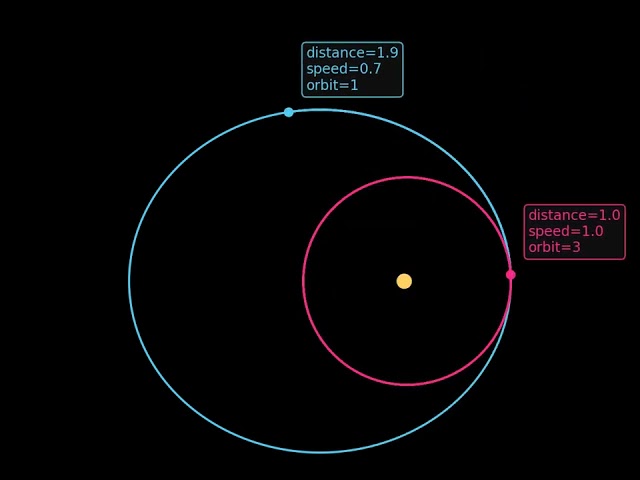
Two planets, one star, and the beauty of orbital motion. In this video, we simulate two planets orbiting the Sun using differential ...
23 views
Struggling with complex mappings? This example will change everything. In this video, we take a triangle in the complex plane ...
25 views