ViewTube

ViewTube
Sign inSign upSubscriptions
Filters

Upload date

Type

Duration

Sort by

Features

Reset

42 results

The Debug Zone
Matplotlib Make Center Circle Transparent

Today's Topic: Matplotlib Make Center Circle Transparent Thanks for taking the time to learn more. In this video I'll go through your ...

3:07
Matplotlib Make Center Circle Transparent

0 views

29 minutes ago

Sushant Sharma
AI Engineer Course | "Master MATPLOTLIB.pyplot " Part 03 DAY 17!!!!

Welcome to the official orientation for your 180-Day "Job Ready" AI Engineer Course. This isn't just another tutorial series. This is ...

31:41
AI Engineer Course | "Master MATPLOTLIB.pyplot " Part 03 DAY 17!!!!

15 views

19 hours ago

Alphorm
Visualisation des performances avec Matplotlib

Comment visualiser les performances de votre modèle avec Matplotlib ? Découvrez comment utiliser Matplotlib pour créer des ...

11:09
Visualisation des performances avec Matplotlib

8 views

1 hour ago

Mobilo
Matplotlib - About the course

Python reigns supreme in data analysis. However, data placed in a table can't speak for itself. Learn to add plots to your ...

1:33
Matplotlib - About the course

0 views

9 hours ago

Ash2Tutorial
5 Save figure

Code: https://github.com/ash322ash422/youtube/blob/main/matplotlib/L05-save-figure.ipynb Complete playlist for matlotlib: ...

3:27
5 Save figure

4 views

22 hours ago

MP Board Commerce Class12th - Arivihan
MP Board Class 12 - Data Handling using Pandas & and Plotting Data (IP) अंतिम युद्ध🔥 | Maha Revision

MP Board Class 12 - Data Handling using Pandas & and Plotting Data (IP) अंतिम युद्ध | Maha Revision ...

Upcoming
MP Board Class 12 - Data Handling using Pandas & and Plotting Data (IP) अंतिम युद्ध🔥 | Maha Revision

0 views

0

MLWorks
🔥 Building Local Data Explorer using Open-Source tools | Streamlit + Ollama + ML Libraries

Build a Private, Local Data Explorer with AI! Tired of uploading sensitive data to cloud-based AI tools? In this video, we build a ...

16:20
🔥 Building Local Data Explorer using Open-Source tools | Streamlit + Ollama + ML Libraries

14 views

13 hours ago

Ash2Tutorial
6 subplot: Display multiple plots in one figure

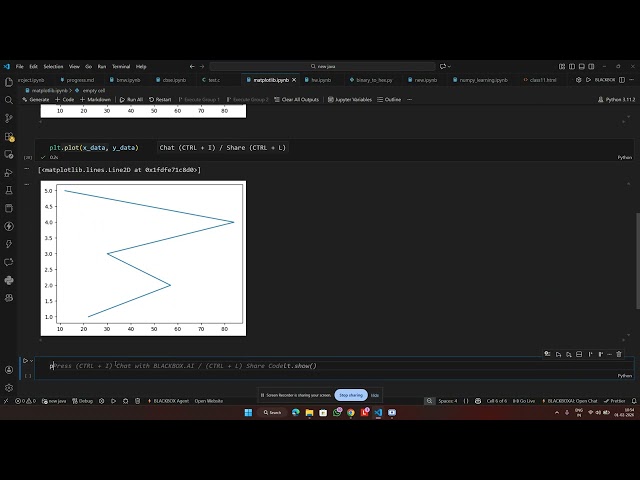
Code: https://github.com/ash322ash422/youtube/blob/main/matplotlib/L06-subplot.ipynb Complete playlist for matlotlib: ...

3:02
6 subplot: Display multiple plots in one figure

3 views

20 hours ago

Ash2Tutorial
4 Histogram

Code: https://github.com/ash322ash422/youtube/blob/main/matplotlib/L04_histogram.ipynb Complete playlist for matlotlib: ...

8:07
4 Histogram

4 views

22 hours ago

primejava_official
Machine Learning with Python for Beginners (2026)

MachineLearning#Python#MachineLearningWithPython#MLForBeginners#DataScience#ArtificialIntelligence#PythonTutorial# ...

22:25
Machine Learning with Python for Beginners (2026)

10 views

21 hours ago

AronAyub
Raspberry Pi Image Classification Setup | OpenCV, Python & Virtual Environments

In this video, we set up a complete image classification and computer vision environment on Raspberry Pi from scratch. You'll ...

6:52
Raspberry Pi Image Classification Setup | OpenCV, Python & Virtual Environments

14 views

12 hours ago

Dive in Data
SQL - Latest Order Placed By Each Customers | Top 75 SQL Interview Coding Questions

Download the E-Commerce database used in this video here: ...

6:57
SQL - Latest Order Placed By Each Customers | Top 75 SQL Interview Coding Questions

10 views

18 hours ago

Руслан Сенаторов | Школа Data Science, ML, Python
Машинное обучение с нуля: Линейная регрессия на python. Data Science. Уроки для начинающих.

00:00:00 Введение в задачу • Описание задачи: написание алгоритма линейной регрессии с функцией потерь MSE.

Live
Машинное обучение с нуля: Линейная регрессия на python. Data Science. Уроки для начинающих.

1 view

0

Labmentix
Uber Data Analysis Project | EDA Using Python | Real-World Data Analytics | Labmentix

Want to learn how real data analysts work on industry datasets? In this video, we perform Exploratory Data Analysis (EDA) on a ...

33:19
Uber Data Analysis Project | EDA Using Python | Real-World Data Analytics | Labmentix

0 views

2 hours ago

SENATOROV | Школа Машинного Обучения, Data science
Машинное обучение с нуля: Линейная регрессия на python. Data Science. Уроки для начинающих.

00:00:00 Введение в задачу • Описание задачи: написание алгоритма линейной регрессии с функцией потерь MSE.

Live
Машинное обучение с нуля: Линейная регрессия на python. Data Science. Уроки для начинающих.

0 views

0

Sir Bolankhan
Multiple Plots & Subplots in Matplotlib | Python Data Visualization | Data Analyst | Hindi/Urdu

Is video mein hum Multiple Plots aur Subplots using Matplotlib ko step-by-step seekhenge jo Data Visualization aur ...

17:06
Multiple Plots & Subplots in Matplotlib | Python Data Visualization | Data Analyst | Hindi/Urdu

0 views

15 hours ago

芽芽學步
【cmocean】The True Colors of Oceanography

This video highlights why choosing the right color map is critical for scientific integrity. A poorly chosen palette can ...

1:50
【cmocean】The True Colors of Oceanography

8 views

19 hours ago

EconMastering
Article 02 : Stop Guessing, Start Seeing: Mastering Data Visualization with Matplotlib & Seaborn
6:06
Article 02 : Stop Guessing, Start Seeing: Mastering Data Visualization with Matplotlib & Seaborn

0 views

21 hours ago

Rahul Banerjee
Matplotlib
59:06
Matplotlib

0 views

1 day ago

Mind and Machines
Data Science con Python e IA: dai dati grezzi agli insight

Per i miei percorsi formativi completi a prezzo scontato: ...

1:26
Data Science con Python e IA: dai dati grezzi agli insight

1 view

10 hours ago