Upload date
All time
Last hour
Today
This week
This month
This year
Type
All
Video
Channel
Playlist
Movie
Duration
Short (< 4 minutes)
Medium (4-20 minutes)
Long (> 20 minutes)
Sort by
Relevance
Rating
View count
Features
HD
Subtitles/CC
Creative Commons
3D
Live
4K
360°
VR180
HDR
3,407 results
To learn for free on Brilliant, go to https://brilliant.org/techwithtim . Brilliant's also given our viewers 20% off an annual Premium ...
6,658 views
8 days ago
Our favourite plotting library may just be matplotlib again now that we made it interactive with a puck! It may sounds strange at first, ...
6,109 views
4 days ago
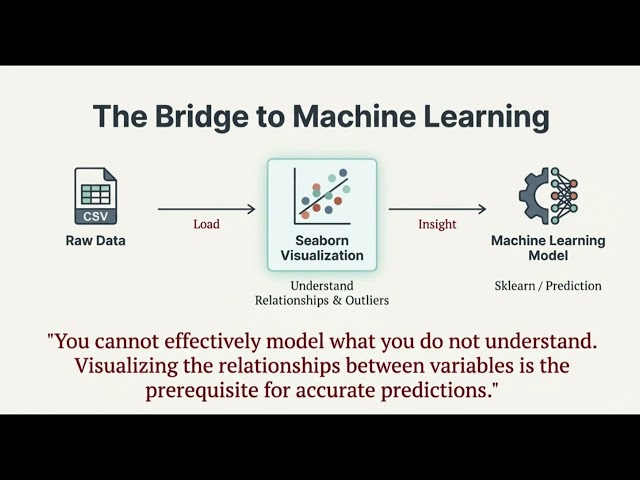
This video today is a crash course on Seaborn, a data visualization library for Python built on top of Matplotlib. It makes it super ...
5,816 views
2 weeks ago
Matplotlib Tutorial in 30 Minutes | Python Data Visualization for Beginners Learn Matplotlib in just 30 minutes This ...
48 views
1 month ago
Matplotlib Python Tutorial for Beginners | Data Visualization in Python Matplotlib is a python library used for data ...
4,672 views
Learn Python NumPy and Matplotlib libraries from scratch in this complete beginner-friendly tutorial. In this video, we explain how ...
23 views
3 weeks ago
Matplotlib is powerful — but many developers struggle once they go beyond a simple plot. In this video, you'll unlock Matplotlib ...
120 views
4 weeks ago
An introductory notebook covering the fundamentals of data visualization using Matplotlib. This project demonstrates how to ...
3 views
Become a data visualization expert with a 30% discount: https://www.matplotlib-journey.com/ Pyfonts is a Python package that ...
133 views
In this video, you'll learn how to create a polar plot in Python using Matplotlib and NumPy. Polar plots are useful for visualizing ...
In this video, we build a complete end-to-end data pipeline using Python. You will learn how to fetch real data from an API, handle ...
17 views
Day 19/365 Today I explored Seaborn, the visualization library that makes data beautiful & meaningful. In 40–60 seconds, ...
1 view
13 days ago
This video gives a clear and concise explanation of Matplotlib for quick revision and exam preparation Learn how to create ...
4 views
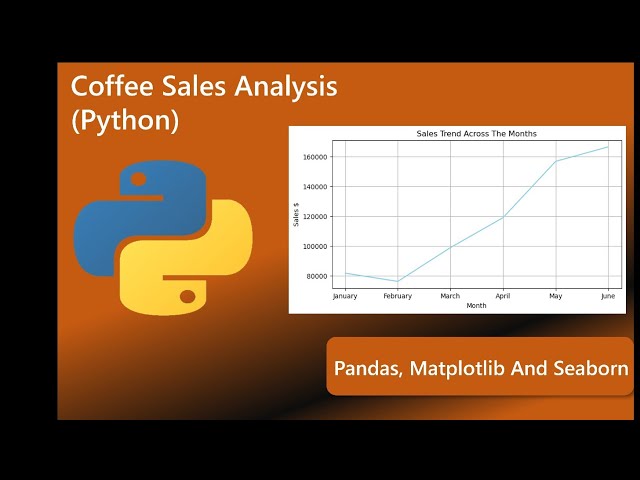
This video shows a complete coffee sales analysis using Python. The analysis is done with Pandas for data cleaning, ...
41 views
In this video learn the basics of how to make a pie chart in Matplotlib. And see how I used it to analyze some of my chess game ...
19 views
What is a Funnel Chart and how can you create one using Python and Matplotlib? In this video, you'll learn how to create a ...
2 views
What happens when circular waves overlap? In this video, you'll see how to visualize circular wave superposition using Python ...
0 views
12 days ago
In this video, we explain Matplotlib and Seaborn in simple Hindi using Python. You will learn how to create beautiful and ...
27 views
7 days ago
In this video, I present my Retail Sales Exploratory Data Analysis (EDA) project using Python. This project focuses on analyzing ...
34 views
Day 18 of my AI/Data Science journey Today I learned Matplotlib, the foundation of data visualization. In just 60 seconds, you'll ...
Introduction to Histograms in Matplotlib: Master Data Distribution Visualization & Implementation #matplotlib #datavisualization ...
78 views
00:00 Welcome, and hunkering 01:42 We're talking about primes 07:00 Let's code! Our first prime finding algorithm 22:42 Modular ...
790 views
Streamed 9 days ago
Python code file: ...
156 views
Welcome to Your Ultimate Learning Hub for AI & Data Technologies! This channel is dedicated to learning Artificial Intelligence, ...