ViewTube

ViewTube
Sign inSign upSubscriptions
Filters

Upload date

Type

Duration

Sort by

Features

Reset

481 results

marimo
matplotlib, made interactive.

Our favourite plotting library may just be matplotlib again now that we made it interactive with a puck! It may sounds strange at first, ...

12:08
matplotlib, made interactive.

6,081 views

4 days ago

Roboduino
How to Install Python Libraries ( OpenCV, MediaPipe & Matplotlib ) 🖥️✨ Step-by-Step

In this video, I show how to install Python libraries step by step, including OpenCV, MediaPipe, and Matplotlib, without confusion ...

4:59
How to Install Python Libraries ( OpenCV, MediaPipe & Matplotlib ) 🖥️✨ Step-by-Step

23 views

2 days ago

Rishabh Mishra
Matplotlib Python Tutorial for Beginners | Data Visualization in Python

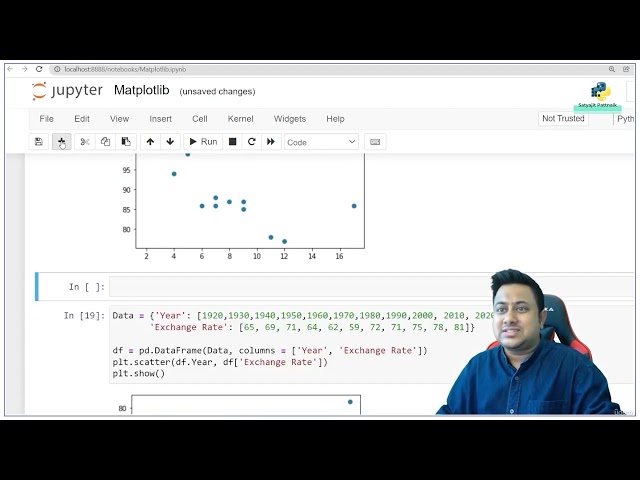
Matplotlib Python Tutorial for Beginners | Data Visualization in Python Matplotlib is a python library used for data ...

39:20
Matplotlib Python Tutorial for Beginners | Data Visualization in Python

4,645 views

4 days ago

Useful Videos
24 Matplotlib
26:38
24 Matplotlib

0 views

7 days ago

PyPlus
How to Create a Stacked Area Plot Using Python | Matplotlib Visualization

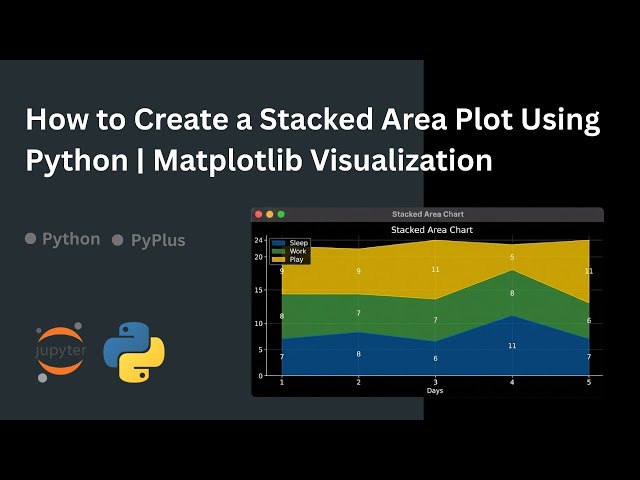
What is a stacked area plot and how can you create one using Python? In this video, you'll learn how to visualize multiple ...

1:37
How to Create a Stacked Area Plot Using Python | Matplotlib Visualization

0 views

6 days ago

Anahata Intelligence
Scatter plot using matplotlib python library
10:15
Scatter plot using matplotlib python library

0 views

6 days ago

Anahata Intelligence
Matplotlib python library
13:40
Matplotlib python library

0 views

6 days ago

PyPlus
How to Draw the Google Logo Using Python | Matplotlib Text Art

What if you could draw the Google logo using Python? In this video, you'll learn how to create a colorful Google-style text ...

4:13
How to Draw the Google Logo Using Python | Matplotlib Text Art

0 views

4 days ago

Dr Owen Mtambo's Maths, Statistics & Computing
Data Visualization Part 2 | Pandas, NumPy, Matplotlib & Seaborn

DataVisualization #PythonDataVisualization #Python #Matplotlib #Seaborn #Pandas #NumPy #DataScience #DataAnalysis ...

1:17:56
Data Visualization Part 2 | Pandas, NumPy, Matplotlib & Seaborn

41 views

1 day ago

Anahata Intelligence
Boxplot & scatterplot in Python libraries using matplotlib
14:59
Boxplot & scatterplot in Python libraries using matplotlib

0 views

6 days ago

Code Swanky
8. Bioinformatics with Python: Visualizing GC Content with Matplotlib

Data is only as good as your ability to communicate it! In this video, we step away from the terminal and into the world of data ...

10:09
8. Bioinformatics with Python: Visualizing GC Content with Matplotlib

10 views

1 day ago

Advanced Coding Lab
Python Matplotlib Tutorial | Create Stunning Charts and Graphs @AdvancedCodingLab

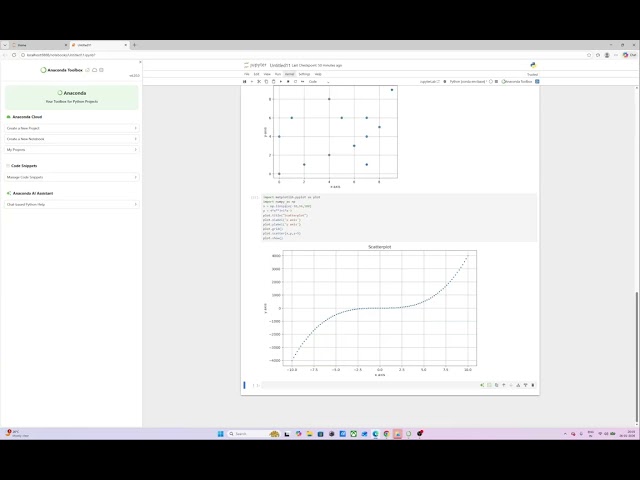
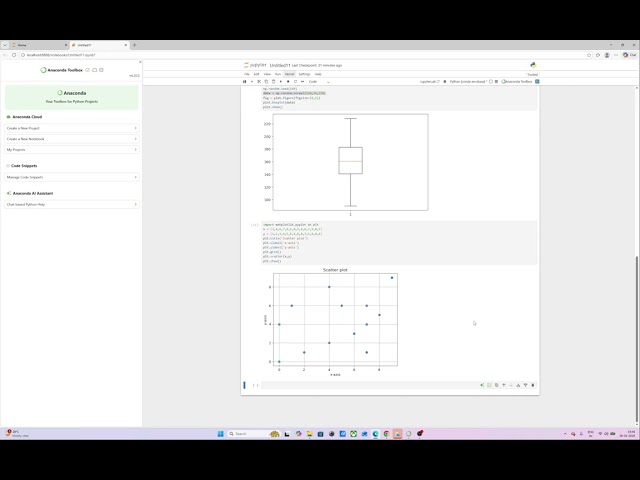
In this video, you will learn how to create different types of data visualization graphs using Python. We will cover popular graph ...

10:09
Python Matplotlib Tutorial | Create Stunning Charts and Graphs @AdvancedCodingLab

0 views

6 days ago

STUDYSCIENCE
Pendulum Motion Animation Using Python #matplotlib

biology #chemistry #education #astronomy #science #python #coding #programming #jupyter #world #news #matplotlib #numpy ...

17:19
Pendulum Motion Animation Using Python #matplotlib

4 views

6 days ago

TechnoDen0
Plotting with matplotlib part1

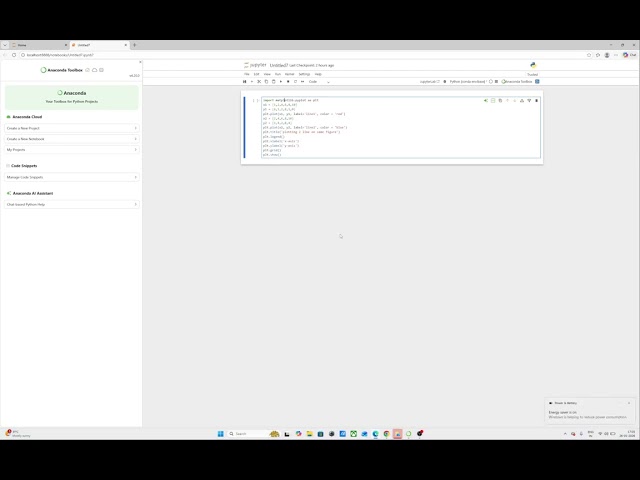
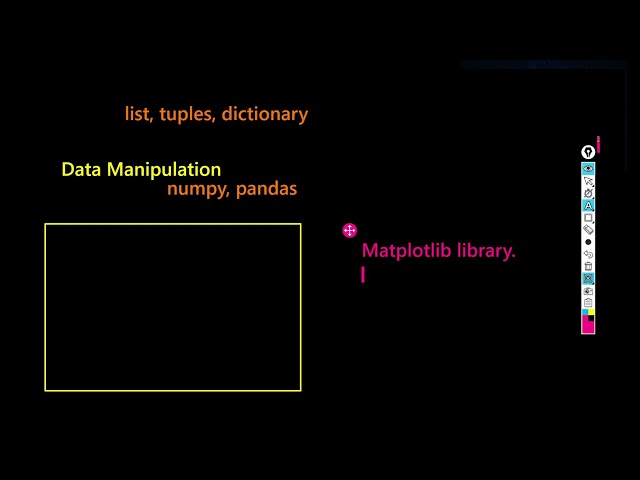
This video is introductory video of plotting the graphs using matplotlib library.

12:59
Plotting with matplotlib part1

0 views

3 days ago

The Debug Zone
Make interactive matplotlib window not pop to front on each update (Windows 7)

Today's Topic: Make interactive matplotlib window not pop to front on each update (Windows 7) Thanks for taking the time to learn ...

1:22
Make interactive matplotlib window not pop to front on each update (Windows 7)

0 views

6 days ago

The Debug Zone
Scatter plot label overlaps - matplotlib

Today's Topic: Scatter plot label overlaps - matplotlib Thanks for taking the time to learn more. In this video I'll go through your ...

1:22
Scatter plot label overlaps - matplotlib

0 views

2 days ago

The Debug Zone
Matplotlib's autoscale doesn't seem to work on y axis for small values?

Today's Topic: Matplotlib's autoscale doesn't seem to work on y axis for small values? Thanks for taking the time to learn more.

1:22
Matplotlib's autoscale doesn't seem to work on y axis for small values?

1 view

1 day ago

TheKnowledgeBase
matplotlib.pyplot.axes() arguments confusion

tech,tech news,best tech,cheap tech,tech gifts,weird tech,tech fails,ces 2025 tech,ces tech,big tech,dog tech,new tech,top tech ...

1:04
matplotlib.pyplot.axes() arguments confusion

0 views

3 days ago

Artifact_live
Matplotlib

JUST FOR EDUACTION.

5:25
Matplotlib

0 views

7 days ago

Monesh Venkul
04   Master Data with Numpy, Matplotlib & Scikit Learn!

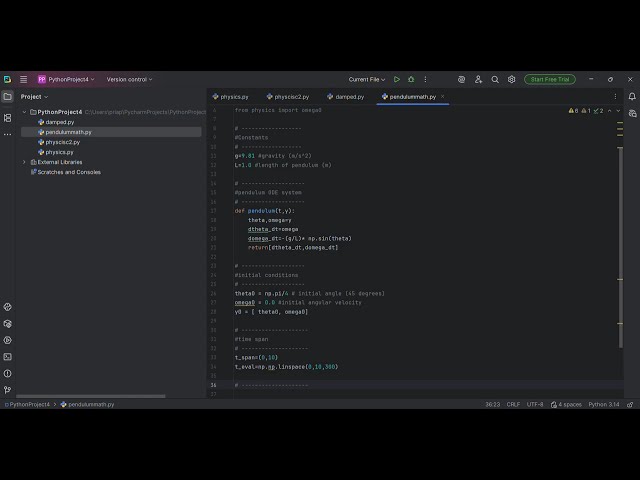
04 - Master Data with Numpy, Matplotlib & Scikit-Learn! In this video: Dive into the essentials of data manipulation using powerful ...

1:55:31
04 Master Data with Numpy, Matplotlib & Scikit Learn!

5 views

5 days ago