ViewTube

ViewTube
Sign inSign upSubscriptions
Filters

Upload date

Type

Duration

Sort by

Features

Reset

9,647,498 results

Visme
Data Visualization in 2026 | The Ultimate Guide

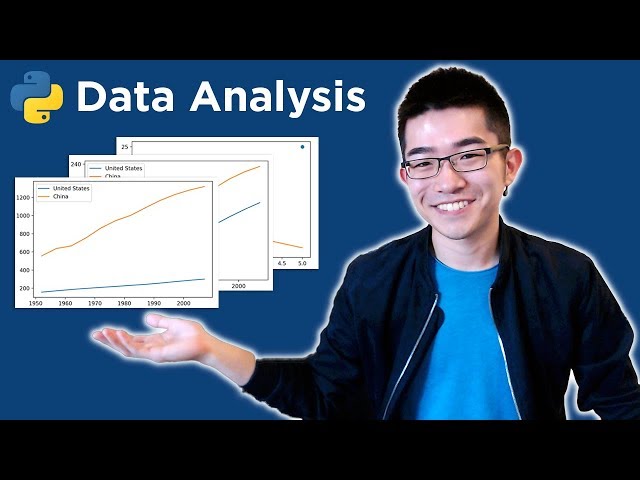
You've probably heard the term data visualization thrown around a lot. It's why you're here, isn't it? So let's make it clear — data ...

11:02
Data Visualization in 2026 | The Ultimate Guide

181,395 views

3 years ago

Simplilearn
Data Visualization Tutorial For Beginners | Big Data Analytics Tutorial | Simplilearn

"️ IBM - Data Analyst ...

27:21
Data Visualization Tutorial For Beginners | Big Data Analytics Tutorial | Simplilearn

320,616 views

8 years ago

nullQueries
Using Design Techniques for Clear and Appealing Data Visualization

Let's look at how we can implement design concepts and techniques to maximize the impact of our dashboards and reports.

4:17
Using Design Techniques for Clear and Appealing Data Visualization

86,740 views

4 years ago

freeCodeCamp.org
Excel Data Visualization Course – Guide to Charts & Dashboards

This comprehensive tutorial will teach you everything you need to know about Excel chart types, chart customization, and creating ...

1:10:23
Excel Data Visualization Course – Guide to Charts & Dashboards

110,874 views

1 year ago

Analyst Academy
Data Visualization Crash Course | Consulting Best Practices

Links mentioned in this video ⬇️ Exercise File ...

25:57
Data Visualization Crash Course | Consulting Best Practices

250,153 views

2 years ago

Christine Jiang
Data Storytelling 101 | Think Like a Data Analyst

MENTORSHIP – Applications for the March 2026 cohort are now open! Apply here → https://theanalyticsaccelerator.com/ We're ...

12:55
Data Storytelling 101 | Think Like a Data Analyst

50,484 views

11 months ago

Lore So What
All You Need to Know About Data Visualization

Join my Academy, learn Data & AI skills and land a job https://analyticsautomation.academy/ Mind map available here ...

23:02
All You Need to Know About Data Visualization

4,834 views

4 months ago

UNDATABLE
How To Choose The Right Graph (Types of Graphs and When To Use Them)

In this Chart, Graph and Data Visualization tutorial for beginners, find out everything you need to know to choose the right type of ...

5:03
How To Choose The Right Graph (Types of Graphs and When To Use Them)

229,477 views

4 years ago

Dr. Asif’s Mol. Biology
Best Free Data Visualization Tool for Publication-Ready Graphs | RawGraphs.io Tutorial

Welcome to this video on RawGraphs.io, an open-source data visualization tool designed for everyone—from beginners to data ...

8:24
Best Free Data Visualization Tool for Publication-Ready Graphs | RawGraphs.io Tutorial

1,880 views

9 months ago

Excel Dictionary
How to visualize data with Python in Excel. 🤯 #excel  #python #tutorial

Saw the intern visualizing his data like this so I showed him this tip activate python store your data as a python data.

0:38
How to visualize data with Python in Excel. 🤯 #excel #python #tutorial

83,261 views

1 year ago

MTR Animation
INSANE NEW Data Visualization Tool Using Blender 4.5!

Use the code "DATA" to get 25% off The Big Nodebook!!! https://mtranimationgumroad.gumroad.com/l/thebignodebook/DATA Use ...

33:51
INSANE NEW Data Visualization Tool Using Blender 4.5!

100,755 views

6 months ago

Adam Finer - Learn BI Online
🚨 YOU'RE VISUALIZING YOUR DATA WRONG. And Here's Why...

In this video, I break down some of the 'science' behind effective data visualization and how you can build better dashboards by ...

17:11
🚨 YOU'RE VISUALIZING YOUR DATA WRONG. And Here's Why...

383,894 views

2 years ago

Alex The Analyst
How to Install Tableau and Create First Visualization | Tableau Tutorials for Beginners

Check out my Full Tableau Course Here: https://www.analystbuilder.com/courses/tableau-for-data-visualization This is our first of ...

17:04
How to Install Tableau and Create First Visualization | Tableau Tutorials for Beginners

984,461 views

4 years ago

CS Dojo
Intro to Data Analysis / Visualization with Python, Matplotlib and Pandas | Matplotlib Tutorial

Python data analysis / data science tutorial. Let's go! For more videos like this, I'd recommend my course here: ...

22:01
Intro to Data Analysis / Visualization with Python, Matplotlib and Pandas | Matplotlib Tutorial

1,532,533 views

7 years ago

Code with Josh
Learn Data Visualization with Matplotlib in Python: A Beginner’s Guide

Join my Python Masterclass - https://www.zerotoknowing.com/join-now ***Save 20% off your First Month with code: save20now at ...

32:29
Learn Data Visualization with Matplotlib in Python: A Beginner’s Guide

17,070 views

1 year ago

Kody Powell
Data Visualization in Power BI: Tutorial Part 1

In this video lecture series, we introduce Power BI (Business Intelligence), show users how to create data dashboards with visuals ...

10:53
Data Visualization in Power BI: Tutorial Part 1

7,148 views

2 years ago

JetBrains Academy
Data Visualization in Python!

Turn raw data into stunning visual stories with our new IDE course, Data Visualization in Python! If you've ever stared at a ...

0:48
Data Visualization in Python!

15,496 views

5 months ago

Mo Chen
The 9 Minute Guide to Better Data Visualization (10 PROVEN METHODS)

Try RESPLENDENT DATA for FREE and unlock the full potential of your data: https://resplendentdata.com/mochen Portfolio, ...

9:13
The 9 Minute Guide to Better Data Visualization (10 PROVEN METHODS)

6,253 views

9 months ago

freeCodeCamp.org
Tableau for Data Science and Data Visualization - Crash Course Tutorial

Learn to use Tableau to produce high quality, interactive data visualizations! Tableau can help you see and understand your data.

28:42
Tableau for Data Science and Data Visualization - Crash Course Tutorial

919,878 views

7 years ago

Janice Journal
3D Art & Data Visualization = 🤯😎 #3dart #datascience #maps

... see how data and 3D can really help us visualize a lot of things that we can't really imagine and also understanding how history ...

0:46
3D Art & Data Visualization = 🤯😎 #3dart #datascience #maps

31,033 views

2 years ago

Data Tutorials
Real Time Power BI Project, Blinkit Analysis #powerbi #powerbidashboard #dataanalyst
0:15
Real Time Power BI Project, Blinkit Analysis #powerbi #powerbidashboard #dataanalyst

1,601,033 views

1 year ago

David Fortin
How to Create Dashboards with Copilot in Excel

How to build insightful Dashboards in Excel with the help of Microsoft Copilot, a powerful AI tool. Copilot Essentials in 15 minutes ...

0:27
How to Create Dashboards with Copilot in Excel

627,981 views

1 year ago