Upload date
All time
Last hour
Today
This week
This month
This year
Type
All
Video
Channel
Playlist
Movie
Duration
Short (< 4 minutes)
Medium (4-20 minutes)
Long (> 20 minutes)
Sort by
Relevance
Rating
View count
Features
HD
Subtitles/CC
Creative Commons
3D
Live
4K
360°
VR180
HDR
1,436,743 results
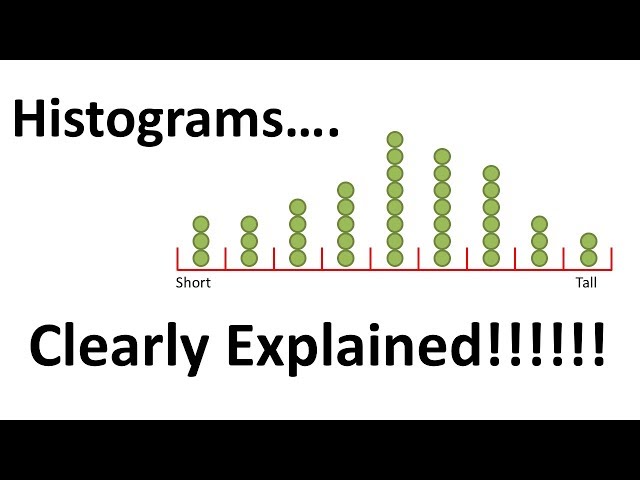
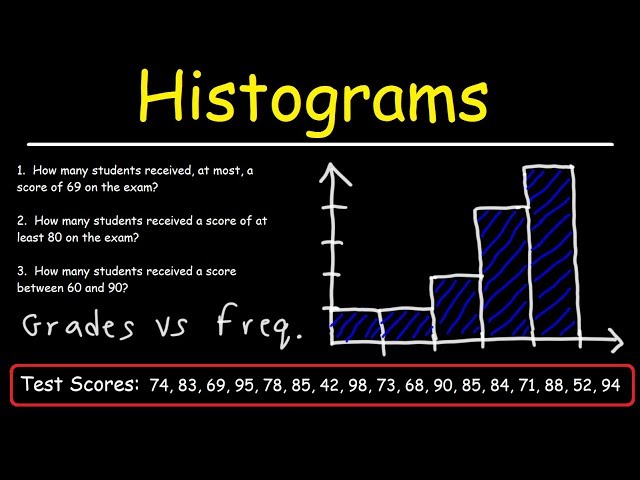
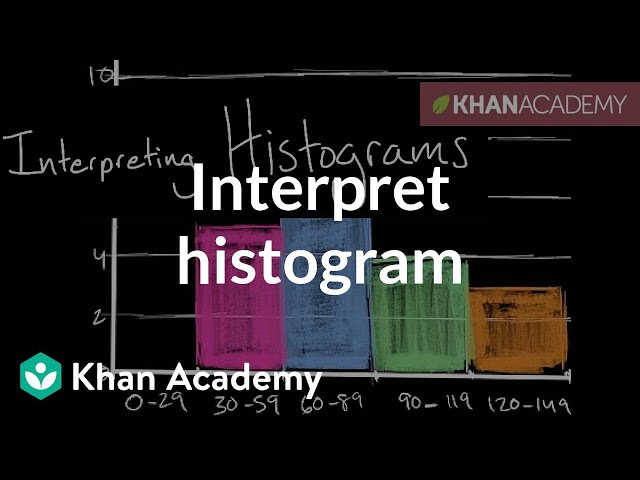
Histograms are one of the most basic statistical tools that we have. They are also one of the most powerful and most frequently ...
958,755 views
8 years ago
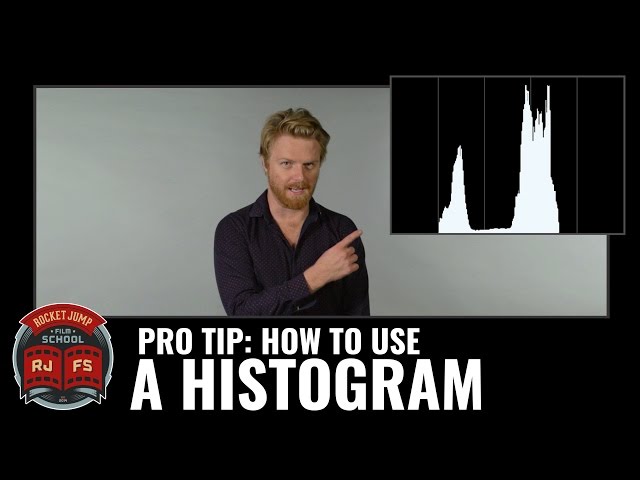
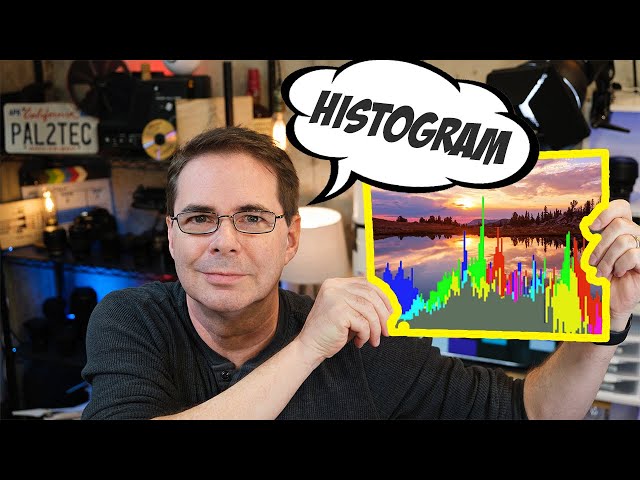
The histogram, a very useful exposure tool. In this video I explain how one can interpret a histogram. ______ Royalty-free music ...
349,777 views
A Histogram is a useful tool for checking exposure and improving your photography. The first 1000 people to use the link will get a ...
207,875 views
5 years ago
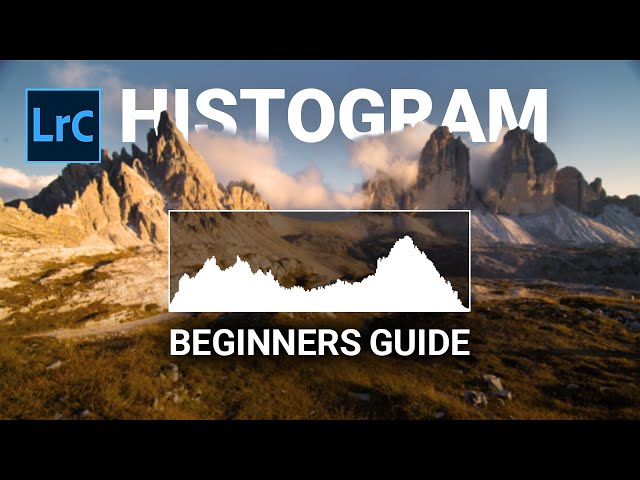
The Histogram is one of the most important things to understand in Photography. This video serves as a beginners guide to the ...
45,515 views
3 years ago
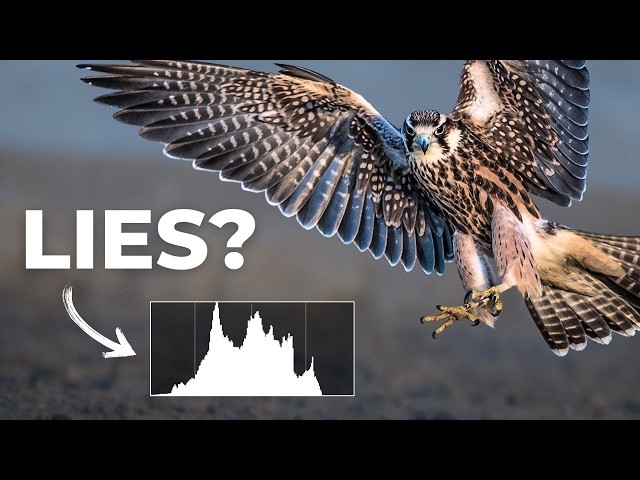
Master Wildlife Photo Editing: https://www.markdumbleton.com/the-wildlife-edit-course?video=D0DxtixmFRY Free Weekly Photo ...
12,197 views
1 year ago
Does the image on the LCD screen often look different than your actual footage? Not quite sure if you are exposing correctly?
255,714 views
9 years ago
Want to take amazing wildlife photos? Check out my new course with 20 modules and over 5 hours of content, no fluff!
434,065 views
This statistics video tutorial explains how to make a histogram using a frequency distribution table. Statistics - Free Formula Sheet: ...
802,631 views
7 years ago
Understanding the histogram in photography and how to use the histogram for Fujifilm cameras. Also covered is Exposing to the ...
148,493 views
4 years ago
In this video tutorial we're going to have a look at how to make a histogram in Excel, which is one of the ways to create a clear ...
942,931 views
In this video, I will show you how to create a histogram from a frequency table. Histograms are graphical representations of data ...
136,473 views
2 years ago
This video is for students aged 14+ studying GCSE Maths. A video explaining how to draw a histogram from a grouped frequency ...
190,524 views
Courses on Khan Academy are always 100% free. Start practicing—and saving your progress—now: ...
498,968 views
15 years ago
487,855 views
10 years ago
This example shows how to make a histogram. Remember that the horizontal axis represents the values of the variables.
1,243,568 views
14 years ago
In this video you will learn how a histogram is different than a bar chart. Welcome to MooMooMath where we upload a new Math ...
238,967 views
View more at http://www.MathAndScience.com. In this lesson, you will learn what a histogram is and how histograms are used in ...
53,511 views
A video revising the techniques and strategies for drawing and interpreting histograms (Higher Only). Join this channel to get ...
175,037 views
In this video we discuss what is a histogram, and how to construct make a histogram graph from a frequency distribution table in ...
287,920 views
6 years ago
You can stay up to date with Matts latest work at https://www.mattgranger.com/ - join the mailing list! Check out the Nikon Expert ...
721,135 views


![What is a Histogram? (Data Analysis & Statistics) - [6-8-29]](/api/proxy/image?url=https%3A%2F%2Fi.ytimg.com%2Fvi%2FBwpkZQZ3ttw%2Fsddefault.jpg)