Upload date
All time
Last hour
Today
This week
This month
This year
Type
All
Video
Channel
Playlist
Movie
Duration
Short (< 4 minutes)
Medium (4-20 minutes)
Long (> 20 minutes)
Sort by
Relevance
Rating
View count
Features
HD
Subtitles/CC
Creative Commons
3D
Live
4K
360°
VR180
HDR
1,432,505 results
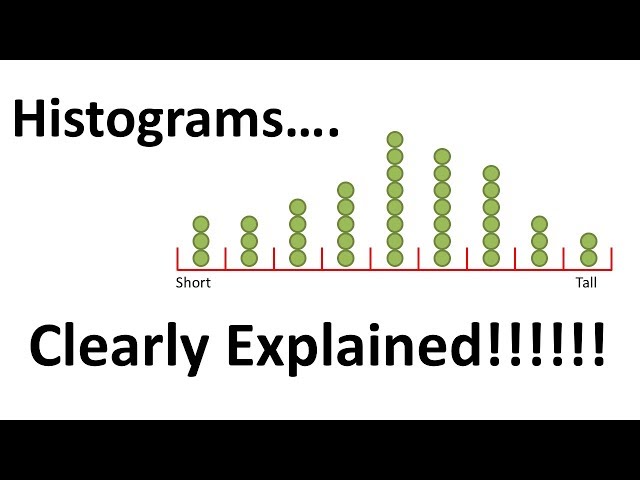
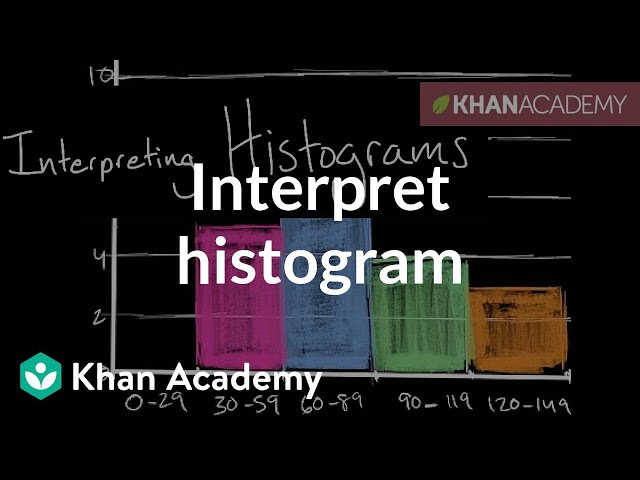
Histograms are one of the most basic statistical tools that we have. They are also one of the most powerful and most frequently ...
957,930 views
8 years ago
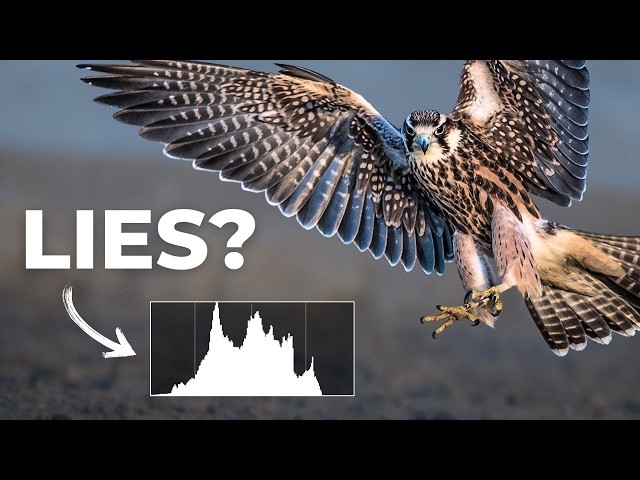
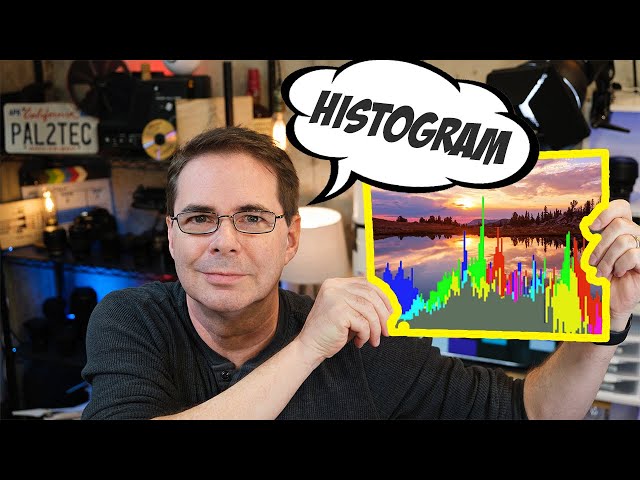
The histogram, a very useful exposure tool. In this video I explain how one can interpret a histogram. ______ Royalty-free music ...
349,666 views
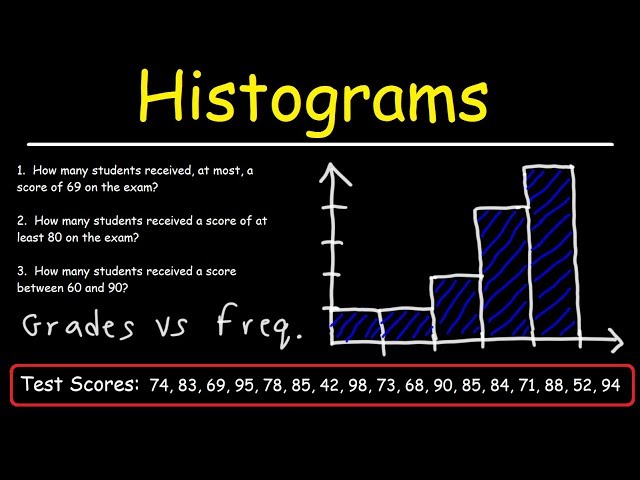
This statistics video tutorial explains how to make a histogram using a frequency distribution table. Statistics - Free Formula Sheet: ...
802,103 views
7 years ago
A Histogram is a useful tool for checking exposure and improving your photography. The first 1000 people to use the link will get a ...
207,786 views
5 years ago
This video is for students aged 14+ studying GCSE Maths. A video explaining how to draw a histogram from a grouped frequency ...
189,717 views
2 years ago
Master Wildlife Photo Editing: https://www.markdumbleton.com/the-wildlife-edit-course?video=D0DxtixmFRY Free Weekly Photo ...
12,176 views
1 year ago
Understanding the histogram in photography and how to use the histogram for Fujifilm cameras. Also covered is Exposing to the ...
148,352 views
4 years ago
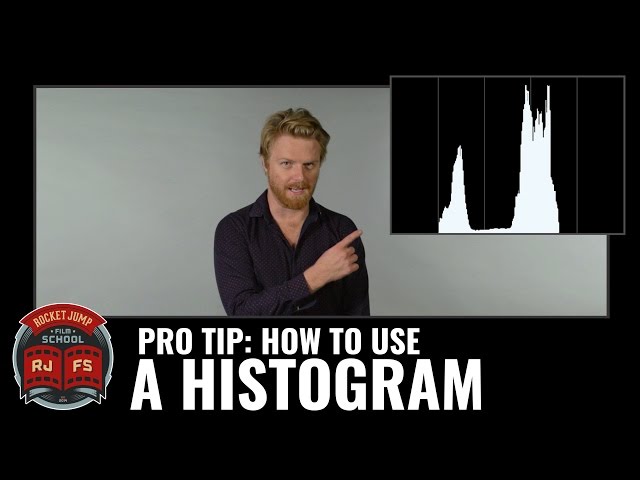
Does the image on the LCD screen often look different than your actual footage? Not quite sure if you are exposing correctly?
255,703 views
9 years ago
In this video, I will show you how to create a histogram from a frequency table. Histograms are graphical representations of data ...
136,260 views
In this video tutorial we're going to have a look at how to make a histogram in Excel, which is one of the ways to create a clear ...
941,767 views
3 years ago
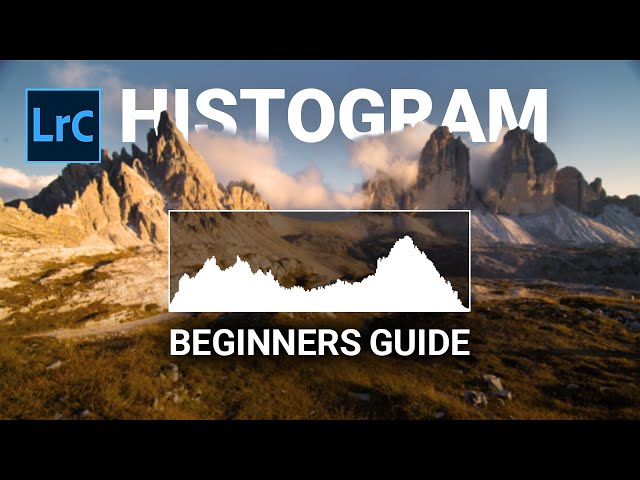
The Histogram is one of the most important things to understand in Photography. This video serves as a beginners guide to the ...
45,459 views
Want to take amazing wildlife photos? Check out my new course with 20 modules and over 5 hours of content, no fluff!
433,940 views
Courses on Khan Academy are always 100% free. Start practicing—and saving your progress—now: ...
487,680 views
10 years ago
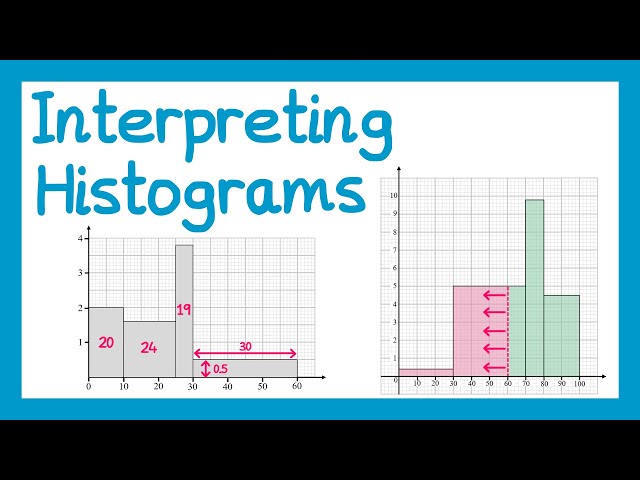
A video revising the techniques and strategies for drawing and interpreting histograms (Higher Only). Join this channel to get ...
174,944 views
View more at http://www.MathAndScience.com. In this lesson, you will learn what a histogram is and how histograms are used in ...
53,450 views
In this video we discuss what is a histogram, and how to construct make a histogram graph from a frequency distribution table in ...
287,521 views
6 years ago
498,902 views
15 years ago
GCSE Maths revision tutorial video. For the full list of videos and more revision resources visit https://www.mathsgenie.co.uk.
281,312 views
This video is for students aged 14+ studying GCSE Maths. *Scale on the last question should say seconds not minutes :) A video ...
158,858 views
In this video, we will be learning how to create histograms in Matplotlib. This video is sponsored by Brilliant.
208,047 views
In this video you will learn how a histogram is different than a bar chart. Welcome to MooMooMath where we upload a new Math ...
238,854 views
This example shows how to make a histogram. Remember that the horizontal axis represents the values of the variables.
1,243,373 views
14 years ago
Join my newsletter https://steven-bradburn.beehiiv.com/subscribe In this video tutorial, I will show you how to create a frequency ...
573,018 views
You can stay up to date with Matts latest work at https://www.mattgranger.com/ - join the mailing list! Check out the Nikon Expert ...
721,123 views
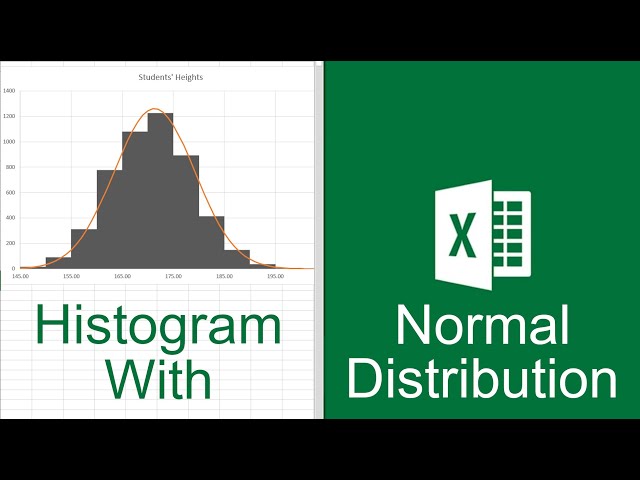
Excel Histogram with Normal Distribution Curve In this video, we will explain how you can create a histogram with a normal ...
274,903 views


![What is a Histogram? (Data Analysis & Statistics) - [6-8-29]](/api/proxy/image?url=https%3A%2F%2Fi.ytimg.com%2Fvi%2FBwpkZQZ3ttw%2Fsddefault.jpg)