Upload date
All time
Last hour
Today
This week
This month
This year
Type
All
Video
Channel
Playlist
Movie
Duration
Short (< 4 minutes)
Medium (4-20 minutes)
Long (> 20 minutes)
Sort by
Relevance
Rating
View count
Features
HD
Subtitles/CC
Creative Commons
3D
Live
4K
360°
VR180
HDR
130,834 results
Check out my Full Tableau Course Here: https://www.analystbuilder.com/courses/tableau-for-data-visualization This is our first of ...
984,460 views
4 years ago
Presented by Alisa Rod. This video is part of a series of lectures recorded to teach about basic data visualization concepts.
321 views
In this video we take a look at the best resources to learn Data Visualization in 2025! 25% off Analyst Builder Code: ...
15,935 views
9 months ago
Hello everyone! In todays video I want to show you how you can use Obsidian for data visualization by using Obsidian Charts, ...
25,772 views
2 years ago
In this video, we dive deep into the world of data visualization in Python using three powerful libraries: Matplotlib, Seaborn, and ...
3,552 views
1 year ago
Welcome to our comprehensive tutorial on **Python PANDAS for Beginners**! In this video, we will dive into the powerful world of ...
102,613 views
In this course you will learn how to visualize data with python matplotlib library. #Matplotlib is very powerful python library that can ...
6 views
Presented by Tess Grynoch. This video is part of a series of lectures recorded to teach about basic data visualization concepts.
29 views
... Data Analysis Specialization - https://coursera.pxf.io/AoYOdR Tableau Data Visualization - https://coursera.pxf.io/MXYqaN ...
217,444 views
3 years ago
This segment covers creating a new project, setting up your working directory, and installing/loading the required packages.
6,866 views
In this Python data visualization tutorial we will learn how to create raincloud plots using Python. To this aim we will use the ...
3,637 views
6 years ago
Whenever we see or generate a data visualization it's important that we review what does and doesn't work in the visual. In this ...
1,866 views
Presented by David Christensen. This video is part of a series of lectures recorded to teach about basic data visualization ...
315 views
Presented by Angela Zoss. This video is part of a series of lectures recorded to teach about basic data visualization concepts.
102 views
This tutorial will teach you hands-on practice on generating visualizations in Python with Matplotlib and also intuitively use. Data ...
47 views
... Katrina and Tim dive into the key differences between Sigma and Tableau, two leading data visualization tools. Katrina recounts ...
7,643 views
Introduction to network analysis and visualization with GEPHI. Datasets and tutorial here: ...
111,447 views
116,660 views
Extended version, originally presented as part of the joint useR! 2021 keynote session: Tools and Technologies for Supporting ...
931 views
2020-03-31 lecture from Advanced Data Analysis course at UW-Madison, https://kbroman.org/AdvData, on data visualization.
154 views
5 years ago
This applied webinar explores best practices for communicating open educational data with a wide audience. Topics include ...
645 views
Data Visualization with Python. Learn Matplotlib, Numpy, line plot, bar plot, scatter plot, histogram, data set, and distribution ...
38 views
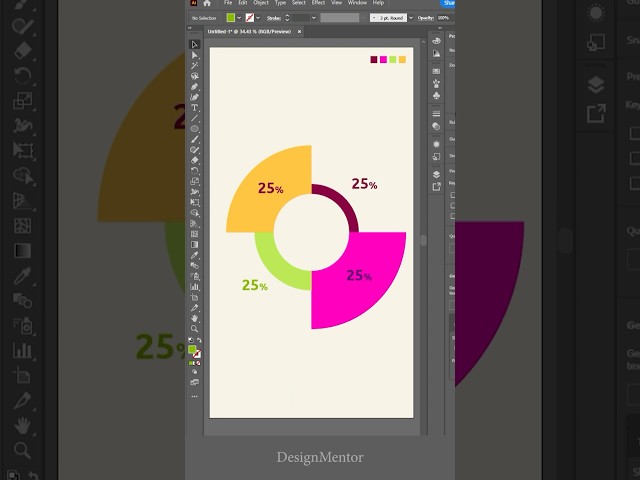
Using Ellipse and Shape Builder create Data Visualization Graph in Adobe Illustrator Adobe Illustrator Tutorial Graphic Designer ...
2,545 views
7 months ago
Dissemination is a critical part of teaching and learning projects. Choosing the best visualizations for sharing quantitative and ...
461 views
Don't train your model without visualizing first! #MachineLearning #PythonTips #DataVisualization #Matplotlib #MLTraining ...
194 views
4 months ago


![Don’t Train Without This Step! Visualize Your Data in Python [3]](/api/proxy/image?url=https%3A%2F%2Fi.ytimg.com%2Fvi%2FLEQAxM_qeM4%2Fsddefault.jpg)