ViewTube

ViewTube
Sign inSign upSubscriptions
Filters

Upload date

Type

Duration

Sort by

Features

Reset

109,547 results

UsefulCharts

2.0499999999999994M subscribers

Alessio Rastani
This Signal Could Change Everything (if it happens in 2026)

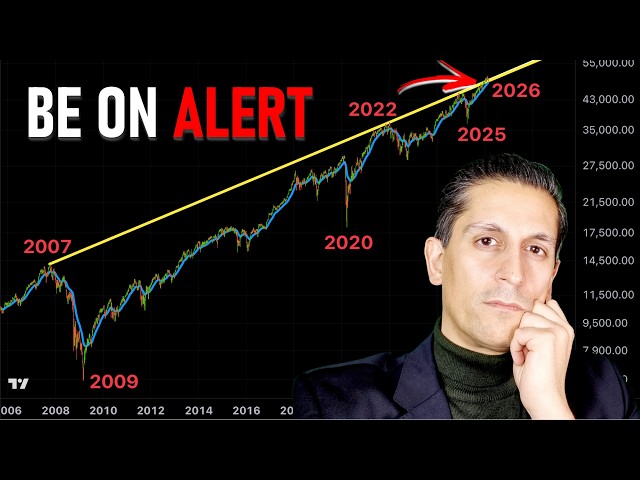
This 19-year chart of stock markets really matters right now. So we should be on alert if the signal that I reveal in the video occurs ...

2:57
This Signal Could Change Everything (if it happens in 2026)

23,129 views

1 day ago

Chart Hackers
Bitcoin Coiling Under Macro Stress  (Next Move Will Be VIOLENT)

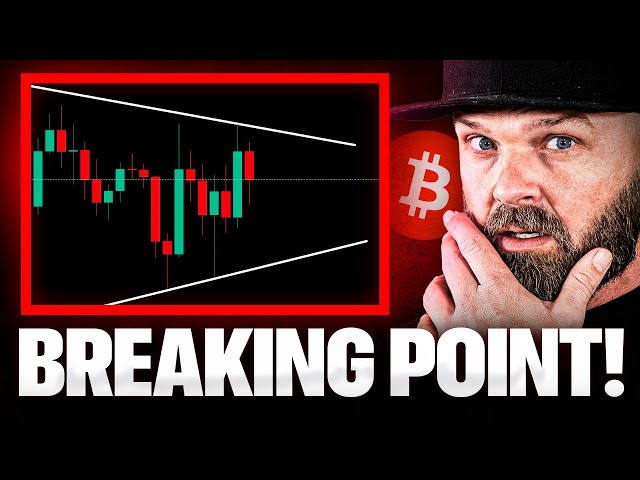
Bitcoin is tightening into a major wedge as macro stress and escalating war pressure shake global markets. In this episode, Dylan ...

48:51
Bitcoin Coiling Under Macro Stress (Next Move Will Be VIOLENT)

4,005 views

Streamed 8 hours ago

Forex Education Live
LIVE 🟠 BITCOIN BTC ( M1 ) & 🔵 ETHEREUM ETH ( M1 ) Educational Chart

Welome, What you see is Educational LIVE Dual Educational Chart for BTC / USD ( cryptocurrency ) & ETH / USD ( cryptocurrency ) ...

Live
LIVE 🟠 BITCOIN BTC ( M1 ) & 🔵 ETHEREUM ETH ( M1 ) Educational Chart

96 views

0

UsefulCharts
Chart of UsefulCharts Charts | 2 Million Subscribers Special

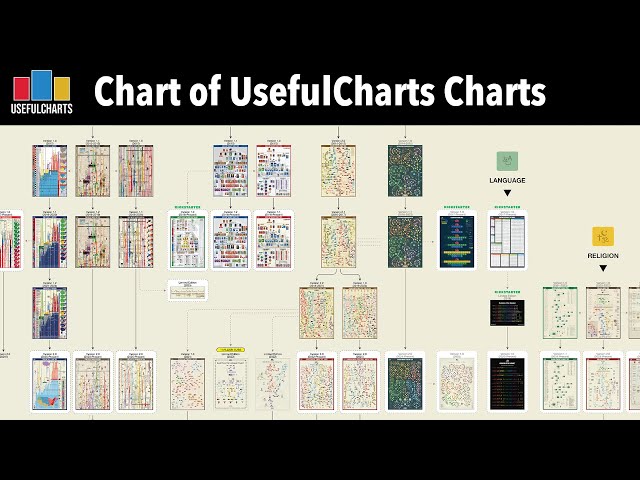
Buy the Limited Edition Chart: https://usefulcharts.com/products/european-royal-family-tree-limited-edition-east-west-mega-chart ...

20:18
Chart of UsefulCharts Charts | 2 Million Subscribers Special

55,957 views

4 months ago

Forex Education Live
LIVE ⚪ SILVER USD TRADING EDUCATIONAL CHART  ( Best Forex Strategy ) XAG SI SIL SLV AG

What you see is Educational Chart with Signals witch is: - Easy to read and understand - With clean and simple setup - Chart is set ...

Live
LIVE ⚪ SILVER USD TRADING EDUCATIONAL CHART ( Best Forex Strategy ) XAG SI SIL SLV AG

133 views

0

Ross Cameron - Warrior Trading
How to Read Candlestick Charts (with ZERO experience)

Keep learning and studying with my Technical Analysis Resource Guide ✓ https://warrior.app/technical-analysis-tool-kit ...
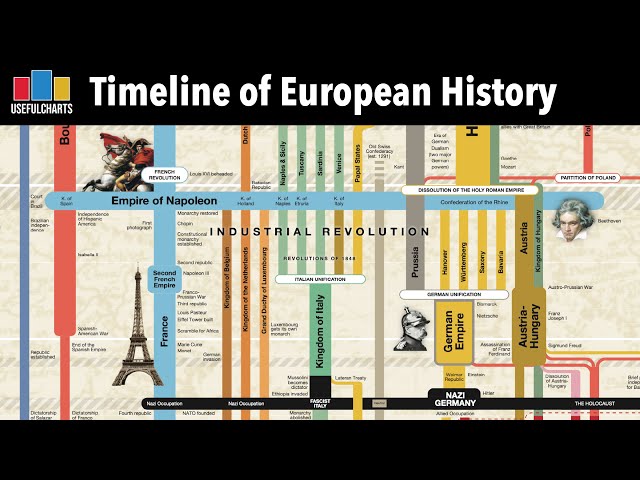
55:18
How to Read Candlestick Charts (with ZERO experience)

3,801,816 views

2 years ago

UsefulCharts
Timeline of European History

Buy the chart: https://usefulcharts.com/products/timeline-of-european-history Chapters: 00:01:05 - Birth of European Kingdoms ...

43:18
Timeline of European History

127,958 views

3 months ago

Channels new to you

Kunal Saraogi
Chart Of The Week 01-03-2026 | War & CRASH!

DISCLAIMER : 1. Kunal Saraogi (Individual) is registered with SEBI as Individual Research Analyst vide Registration number ...

7:38
Chart Of The Week 01-03-2026 | War & CRASH!

32,914 views

2 days ago

More Crypto Online
Bitcoin BTC Chart Analysis - Has Bitcoin Formed an Impulse? Elliott Wave Analysis

This video provides a professional Elliott Wave and technical analysis of Bitcoin (BTC), focusing on market structure, key support ...

5:26
Bitcoin BTC Chart Analysis - Has Bitcoin Formed an Impulse? Elliott Wave Analysis

7,481 views

1 day ago

MCO Global Equities & Commodities
Gold Chart Analysis Today: Key Support Levels Based on Elliott Wave Analysis

This video provides a professional Elliott Wave and technical analysis of the gold market, focusing on the current price structure, ...

3:47
Gold Chart Analysis Today: Key Support Levels Based on Elliott Wave Analysis

2,289 views

7 hours ago

MCO Global Equities & Commodities
Silver Long-Term Roadmap | Elliott Wave Analysis Weekly Chart

This video provides a professional Elliott Wave and technical analysis of the gold market, focusing on the current price structure, ...

9:39
Silver Long-Term Roadmap | Elliott Wave Analysis Weekly Chart

11,045 views

3 days ago

More Crypto Online
Bitcoin BTC Chart Analysis - Has Bitcoin Formed an Impulse? Elliott Wave Analysis

This video provides a professional Elliott Wave and technical analysis of Bitcoin (BTC), focusing on market structure, key support ...

8:34
Bitcoin BTC Chart Analysis - Has Bitcoin Formed an Impulse? Elliott Wave Analysis

4,865 views

1 day ago

HustleBarz
Kendrick Lamar ft. JID & Tech N9ne & Eminem - Charts (Music Video)

Kendrick Lamar ft. JID & Tech N9ne & Eminem - Charts (Music Video) #kendricklamar #eminem #jid #techn9ne.

9:20
Kendrick Lamar ft. JID & Tech N9ne & Eminem - Charts (Music Video)

527,367 views

5 months ago

More Crypto Online
Bitcoin BTC Chart Analysis - Has Bitcoin Formed an Impulse? Elliott Wave Analysis

This video provides a professional Elliott Wave and technical analysis of Bitcoin (BTC), focusing on market structure, key support ...

7:51
Bitcoin BTC Chart Analysis - Has Bitcoin Formed an Impulse? Elliott Wave Analysis

6,125 views

2 days ago

Leila Gharani
The Excel Timeline chart you'll actually keep using (free template included)

Download the timeline chart template: https://www.xelplus.com/excel-timeline-chart/#download-section Stop wrestling with ...

10:56
The Excel Timeline chart you'll actually keep using (free template included)

602,846 views

3 months ago

Public Seva 2
02-03-2026 KALYAN MONDAY CHART SECOND TOUCH LINE TODAY, कल्याण सोमवार जोड़ी लाईन ।।
2:03
02-03-2026 KALYAN MONDAY CHART SECOND TOUCH LINE TODAY, कल्याण सोमवार जोड़ी लाईन ।।

13,702 views

2 days ago

Oliver☀️
📈 USING CHART TOOLS FOR BETTER DECISIONS | NEW TRADING INDICATORS | TECHNICAL ANALYSIS

Trading strategies and ideas* - https://goo.su/IkXTLjz *Activate referral code OLIVER* When studying new trading indicators, ...

7:48
📈 USING CHART TOOLS FOR BETTER DECISIONS | NEW TRADING INDICATORS | TECHNICAL ANALYSIS

9,513 views

5 months ago

Chart Fanatics
Trading LIVE with the #1 Scalper in the WORLD (EXTREME Accuracy)

Want to watch more live trading from Fabio? Click here https://youtu.be/DyS79Eb92Ug. Join The Chart Fanatics FREE Discord ...

3:34:10
Trading LIVE with the #1 Scalper in the WORLD (EXTREME Accuracy)

2,697,825 views

5 months ago

Kevin Stratvert
Excel Charts and Graphs Tutorial

Learn Excel in just 2 hours: https://kevinstratvert.thinkific.com In this step-by-step tutorial, learn how to pull together charts in Excel.

24:31
Excel Charts and Graphs Tutorial

1,277,125 views

2 years ago

IncrediVFX
3D Candlestick Chart Crypto Exchange Finance Market Data Graph Price 4K Moving Wallpaper Background

3D Candlestick Chart Crypto Exchange Finance Market Data Graph Price 4K VJ Loop Background To download, consider ...

1:00:12
3D Candlestick Chart Crypto Exchange Finance Market Data Graph Price 4K Moving Wallpaper Background

246,266 views

4 years ago

TED-Ed
How to spot a misleading graph - Lea Gaslowitz

View full lesson: http://ed.ted.com/lessons/how-to-spot-a-misleading-graph-lea-gaslowitz When they're used well, graphs can help ...

4:10
How to spot a misleading graph - Lea Gaslowitz

3,669,979 views

8 years ago

Felix & Friends (Goat Academy)
Reading Charts for Dummies | The Only Strategy You'll EVER NEED

Get the full Charts for Dummies guide for free: Sign Up Here: https://goatacademy.org/facebook-group Meet Felix: I'm your ...

9:17
Reading Charts for Dummies | The Only Strategy You'll EVER NEED

73,468 views

2 years ago